LMT $600+ but Patience RequiredLarge Diamond top on the monthly but based on the curves path, I believe this breaks to the upside. Still needs more time but ultimately I see this setting up for $600+
299.60 - 325 is a great buying zone.
LOM trade ideas

Nanoracks, Voyager Space, and Lockheed Martin Awarded NASA ContrLMT: Voyager Space; Nanoracks; Lockheed Martin
2021-12-02 16:00:00
Nanoracks, Voyager Space, and Lockheed Martin Awarded NASA Contract to Build First-of-its-Kind Commercial Space Station
Buy $LMT - NRPicks 24 SepLockheed Martin Corporation, a security and aerospace company, is engaged in the research, design, development, manufacture, integration and maintenance of systems. It operates through: Aeronautics, Missiles and Fire Control, Rotary and Mission Systems, and Space.
Revenue TTM 66.8B
Net Income TTM 7.1B
EBITDA TTM 10.2B
Net Margin TTM 10.8%
EBITDA margin TTM 15.3%
P/E 13.39
P/S 1.43
Dividend yield 3.2%

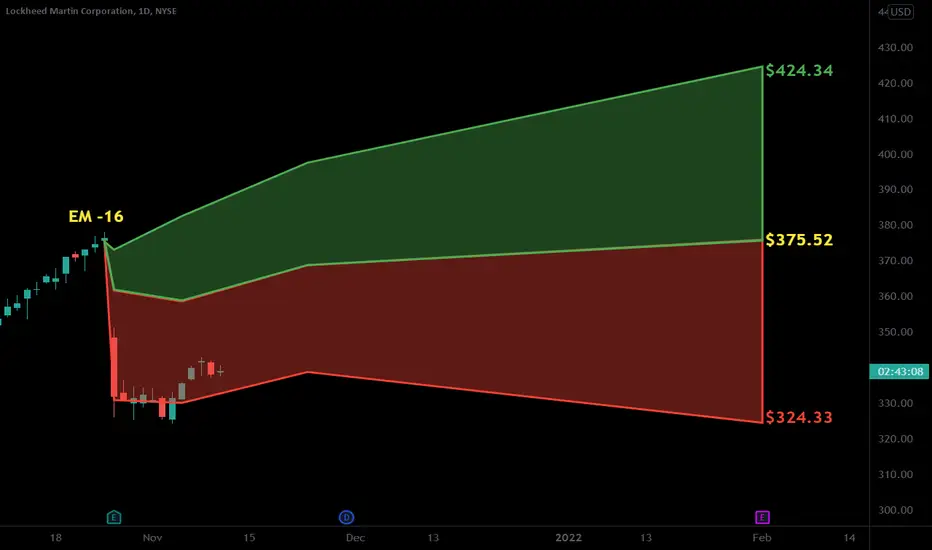
$LMT with a Neutral outlook following its earnings #Stocks The PEAD projected a Neutral outlook for $LMT after a Negative Under reaction following its earnings release placing the stock in drift D with an expected accuracy of 40%.
If you would like to see the Drift for another stock please message us. Also click on the Like Button if this was useful and follow us or join us.

Lockheed LMT possible widening wedge break for reversalLMT Lockheed jhad a full on break from its bear wedge recently. This would be a great time to buy for those wanting to get in on a solid defense stock. Or for those looking to make some quick bucks on futures.


LMT trying, neutral for nowLMT trying to break out of down trend channel and bounce off previous support, maybe a few weeks of sideways before the next leg up. PT 380-400 once it begins to rally again. good luck ! :)

LMT - So, you think the war is over?The market appears to be accumulating weapons manufacturers.
What... you are going to bet against the American military?
Wait for the accumulation or daily/weekly trend to change. It's a monthly equilibrium.

Lockheed Martin Increases Quarterly Dividend And Share RepurchasLMT: Lockheed Martin Corporation
2021-09-23 16:29:00
Lockheed Martin Increases Quarterly Dividend And Share Repurchase Authority


$LMT - Potential reversal?LMT is looking mighty tempting at this area. There's a strong level of support from $340-$343 which it bounced off of today. Can this be the start of the reversal after it has been beaten down? It is in my 2022 portfolio for clients.

Massive Diamond Top/Symmetrical Triangle in LMTLMT is printing, and about to complete a MASSIVE diamond top after an 8 year nearly parabolic uptrend netting it over 350% or $345.
The pattern suggests an implied move of about -44% for the symmetrical triangle if it breaks down, and -57% or roughly -$200 for the diamond top.
If Tradingview's Fixed range indicator was working I'd have some volume analysis for you, but just using the visible range there is next to nothing besides air between it and the measured moves and 1.618 extension at $164.97.

LMT BUY THE DIP!Its looking like LMT is right at support!
Made a position here!
Waiting for a bounce!!!


ABC BullishTarget is D.
Possible stop under C. If price goes more than a few dollars under C, the pattern is no longer valid. There is a gap from a while back under price and movement down halted here for now. There is also a gap over price from a several months ago at 386ish. (red line) If price stalls here again and you were in this, It may be a good time to re-evaluate your position. There will be resistance on the way up from aging price levels, and folks who are stuck up there in financial pain who will sell on any rally that comes their way.
LMT fell from a rising wedge, then had quarterly earnings that were not received well.
Candle tail inverse head and shoulders noted above C. Pocket pivot also noted under C. (green triangle)
Pocket pivots are a way to identify institutions' footprints within a base or an uptrend. Institutions buy within consolidation periods and during uptrends. This buying will leave behind a volume signature, and that volume signature is called a pocket pivot. The definition of a Pocket Pivot is the day’s volume must be larger than any of the down volume days in the prior 10 days.
Negative volume is very high which exhibits smart money interest. Short interest is around 1% which is on the low side. PE is 13.49 EPS 26.84
Revenue appears to be growing quarterly.
Price is below the 50 SMA and the moving averages need work as they are looking droopy except the 200 which is flat. Price is struggling to get above the 200. Moving averages are a lagging indicator compared to price, and it is not unusual to see the averages looks sickly after a deep pull back such as this. Some would prefer to see price steadily above the 50 and the 200 before buying, as well as the 50 over the 200.
Everyone has a different style of trading I suppose and not everyone enjoys bottom fishing or pull back fishing. They just do not enjoy this sport (o: and it can be risky as you can catch stingrays down there. Bottom fishing can be as risky as buying tops. It is very possible to buy and price does not move much for what seems like eons, or it can always continue down. I enjoy it, but we are all different. It is financially rewarding when I catch one at the right time. Mr. Market rarely does the same thing twice.
I did not put the moving averages on the chart as the chart was looking too busy, but you can add them and take a look.
Price fell out of the bottom band but has snapped back inside for now. Depending on the security and on market sentiment, this can be a bearish signal and price could continue down. In other cases it is bullish in a roundabout way as price tends to return to the bands, bottom bouncing, and often will trade to the middle band at least. I ask myself, is there a reason LMT may move up right now, other than the fact I think it is possibly undervalued at this price?
No recommendation

LMT/Lockheed is screaming further bear action. LMT chart is telling me a further bear swipe might take more value off the defense juggernaut.

LMT at Retracement LevelLMT price action this week has begun confirming support at the 50% Retracement of the 2021 bull trend. Price has slowed down and held it for multiple days with a volatility spike adding confirmation yesterday. It is now setting up for optimum short term risk to enter.

LMT tradeI think $LMT is ready to bounce as a c wave to the 1.618 fibo. This is the 50% fibo and longterm trendline for a leading diagonal setup

LMT???Looks like a big symmetrical triangle...can breakout either bullish or bearish. I am currently in a long position.

LMT BIAS: UPThe price has broken away from the channel and ranging. Volume of buyers is increasing. Short term bullish is expected. Make sure to apply SL and TP for your trade.

$LMT with a Bullish outlook following its earnings #Stocks The PEAD projected a Bullish outlook for $LMT after a Negative over reaction following its earnings release placing the stock in drift C
If you would like to see the Drift for another stock please message us. Also click on the Like Button if this was useful and follow us or join us.

Ghost Feed Long. Money printer go whirrrrrrrrCasual reminder that microwaves are for popcorn, not Taco Tuesday's.
Loving that bass though.
Energy efficiency is good for the environment.
