LOCKHEED MARTIN: $413 | when WAR erupts time to LOAD up DefenseCarlyle lobbyist of defense contractors are having a feast reminds me of Carlyle Rumsfeld and Chanyes time during the war in afghan
LOM trade ideas

Long LMT @ 463.501/2 position @ 463.50!
Entry: 463.50
Stop Loss: None Yet (To add on further pull back)
1st PT: 472
Sell the news on earnings recently but this is due for a bounce.

$LMT Looking to bounceBullish setup on LMT, TD9 on the daily, doji in demand. Given the war escalation I could see this moving upwards in the coming weeks. I am long via May 19th 470C from .80

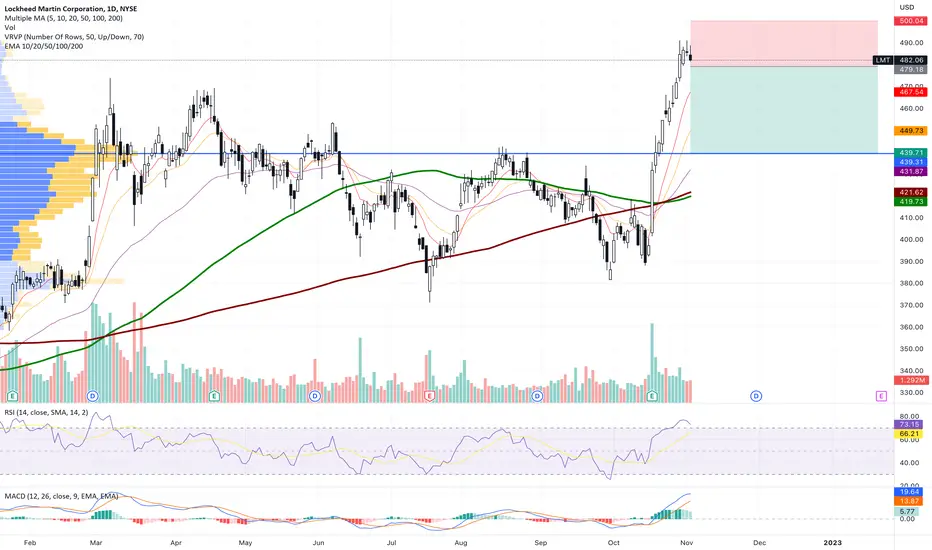
Lockheed Martin - Technical Analysis
Lockheed Martin (LMT) stock may be oversold. Its RSI shows that the stock may be a little oversold. Additionally, a trend line shown above could provide support for the stock, but if it breaks may result in more decline. A modest rise in the S&P 500 tomorrow could allow this reversal to come into fruition.

$LMT with a bearish outlook following its earnings #StocksThe PEAD projected a bearish outlook for NYSE:LMT after a positive over reaction following its earnings release placing the stock in drift B with an expected accuracy of 25%.

The position of buying LMT sharesThe monthly and weekly time frames are bullish and this daily demand is nested within the weekly demand.

LMT Earnings play Earnings Play for LMT
1) Under all EMA's except the 200.
2) Approaching trend line with selling pressure
3) Lower High formed in most recent movement
I would be short on this with caution of the 200ema Target of 473 for tomorrow based off point of control of volume profile

Unlocking potential: Why Lockheed Martin (LMT) is a Strong BuyLockheed Martin Corporation (LMT) is a global aerospace and defense company that has a long history of innovation and excellence. The company is responsible for some of the world's most advanced military technology, including the F-35 Lightning II, the world's most advanced fighter jet. In this article, we will examine why Lockheed Martin is an excellent investment opportunity for those who are looking for a long-term investment.
Technical Analysis:
Looking at the technicals of LMT, we can see that the stock has been in a steady uptrend since late 2020. It has broken through its 50-day and 200-day moving averages, indicating a strong bullish trend. The Relative Strength Index (RSI) is currently at 66, indicating that the stock is not yet overbought. Additionally, the MACD (Moving Average Convergence Divergence) is currently in a bullish crossover, indicating that the stock may have further upside potential.
Financials:
Lockheed Martin has a strong financial position, which is reflected in its impressive financials. In its most recent quarter, the company reported revenue of $16.3 billion, an increase of 4.3% compared to the same period last year. Additionally, the company reported earnings per share (EPS) of $6.56, an increase of 9.9% compared to the same period last year. The company also has a healthy balance sheet, with a debt-to-equity ratio of just 1.17.
Fundamental Analysis:
Looking at the fundamental analysis, LMT is a company with a solid foundation. It has a strong backlog of orders, which currently stands at $147.1 billion. Additionally, the company has a diversified customer base, with the U.S. government being its largest customer. Lockheed Martin has also been investing heavily in research and development, which has resulted in the development of some of the world's most advanced military technology.
Why Invest in Lockheed Martin:
This is a company that is well positioned for growth, both in the short and long-term. The company's strong financial position, impressive financials, and solid fundamentals make it an attractive investment opportunity. Additionally, the company's position as a leader in the aerospace and defense industry, along with its reputation for innovation and excellence, make it a company that is likely to continue to succeed in the future.
In conclusion, based on the technical, financial, and fundamental analysis of LMT, it is a stock that is well worth considering for a long position. With the company's impressive financials, strong fundamentals, and position as a leader in the aerospace and defense industry, LMT is a stock that is likely to continue to deliver long-term growth and success.


LMT Lockheed Martin Options Ahead Of EarningsIf you haven`t bought LMT here:
Then analyzing the options chain of LMT Lockheed Martin prior to the earnings report this week, I would consider purchasing
Calls with a 515usd strike price and an expiration date of 2023-6-16, for a premium of approximately $5.85.
If these options prove to be profitable prior to the earnings release, I would sell at least half of them.
I am interested to hear your thoughts on this strategy.

LMT daily all time high expect ABC correctionLMT daily all time high expect ABC correction at least if we clear this compression below.
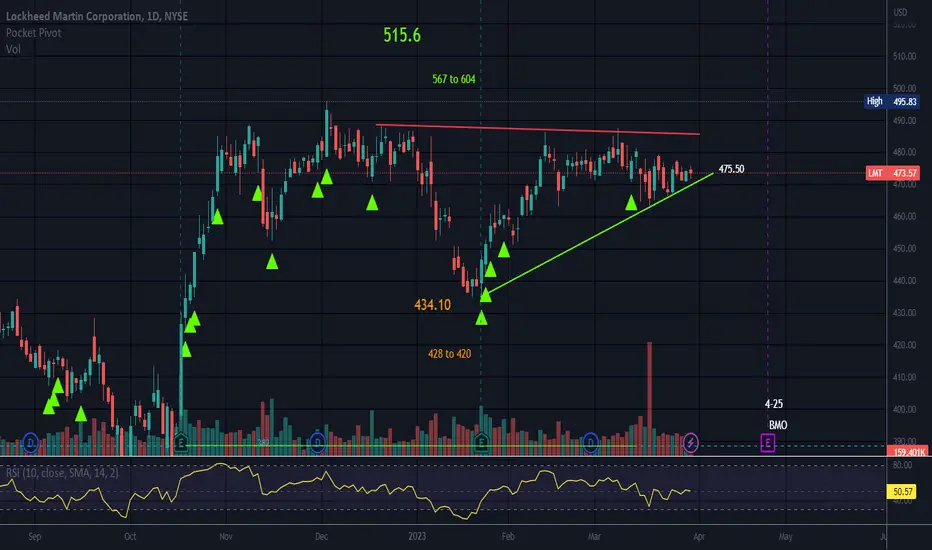
Ascending TriangleTriangles are neutral until broken.
Top line is almost flat and bottom line slopes up.
Price is being pushed in to a tight consolidation zone/apex and will break one way or the other.
No recommendation.
Vision without action is a daydream.
Action without vision is a nightmare.
Lockheed 31723Why I dumped all my Lockheed this am for Bitcoin at 26k. It will outperform LMT. Whether both are going to sell off. Bitcoin will hold up better. It's not my opinion , it is what the chart shows. Dont get me wrong i LOVE lockheed and I will be back

LMT Longany upside move in Monday means continuing strong uptrend which means LMT could make new highs

Lockheed Martin 22223Really looking like an ascending triangle breakout that has confirmed as support. Target could be a move up to 700 but I would need to see 500 cracked first and go from there. We always take it level by level but for me Lockheed is the safest play as a growth stock and I see it has alot of value regardless of insiders dumping

LMT ready for one last breakout?With strong earnings and potentially a final escalation in the Ukraine war, LMT could be primed for a move to the low 500's. $430 support/SL

F22 shoots down hopes of bear market Objects Shot out of U.S airspace is good for the Aerospace and defense sector. LMT hit its ATH trading price less than 3 months ago expect further upside for this industry.

Take-off for Lockheed Martin?Speculative long trade. Price is being supported by
SMA 30 + 50 and EMA 50
50% fib retracement
prior local high
seasonality is rather bullish in the 1st half of this year
global situation seems to demand rather the products by LMT

LMT 21023Attempting to breakout and target 500 dollar psych level. In the bigger picture war is never going away and neither will the toys of war.

Lockheed Martin 2623War. Rumors of war. LMT retesting a previous resistance as support. If it falls under expect to test the bottom of the channel. Could very well continue its grind and climb wall of worry. A very solid stock. Will buy the dip esp if it crashes. If there is a black swan would you have the liquid to buy? If it goes up will you be in max pain bc you were waiting on the dip?

#LMT bullish reversal @ yearly pivotHello dear Traders,
Here is my idea for #LMT
Price closed above yellow line
Targets marked in the chart
Invalidation level marked with red line
Good luck!
❤️Please feel free to ask any question in comments. I will try to answer all! Thank you.
Please, support my work with like, thank you!❤️

$LMT 1-27-2023$LMT levels played out perfectly. Today hit the top of our supply zone and rejected breaking out to the upside.

LMT - MyMI Option PlayLockheed Martin not only landed on a fundamental price level today (The price that it was at before Covid March 2020 Market Crash), but it also acquire roughly a $1B in Volume total, 2nd to JNJ. We like it for the continue concerned across seas that seem to be gaining more and more tension. Whether it's Ukraine/Russia or the worries in Asia, we will be looking to place some CALLs (ITM) to hold at least back to $458 to confirm that a Support to Resistance Conversion is not being completed.
If so, Lockheed could potentially lose support at the $440 Levels and move back down below the 410-420 Price Levels
Regardless, we will be playing options to create a new positioning moving forward.
