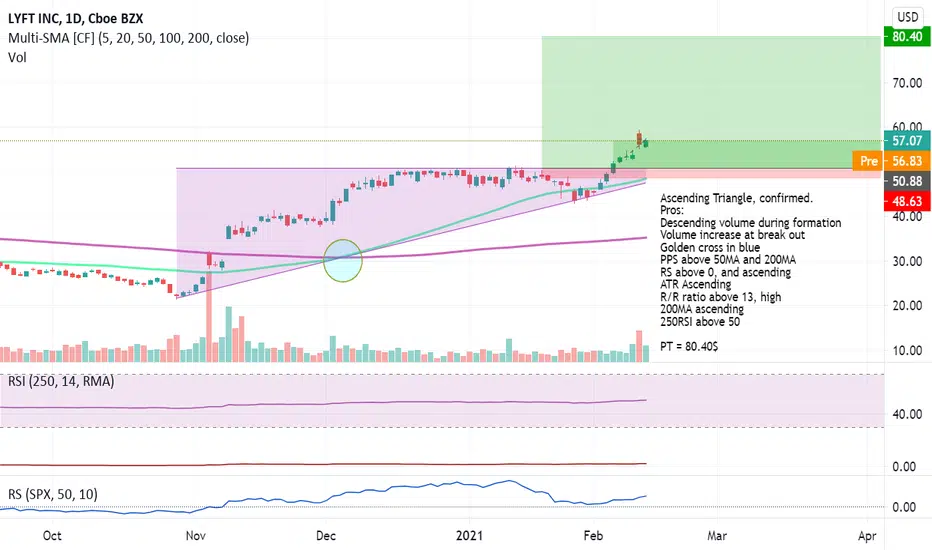
LYFT: Ascending Triangle, confirmedAscending Triangle, confirmed.
Pros:
Descending volume during formation
Volume increase at break out
Golden cross in blue
PPS above 50MA and 200MA
RS above 0, and ascending
ATR Ascending
R/R ratio above 13, high
200MA ascending
250RSI above 50
PT = 80.40$
LY0 trade ideas

LYFT - call options now - 2 day playwatch for small dip
get call options
play to earnings, sell at the high

LYFT - Projected RangeNo position but this is the range I'm guessing it will occupy up til earnings.


$LYFT - take off?I have played options on this a couple of times. Was stopped out once and booked gains the other time
Stochastic and MACD shows nothing but room to boom
ATR is supportive
Watching for reversal
Alert set for $49.31
6/10 bull on this

-17% percent down i don't like this chart only daily time frame. that's it. If you are looking to get in, just WAIT.

LYFT - Drop to lower channel range (Hourly)LYFT should drop back to the lower range of the channel probably over the next day or two.


LYFT FlagLYFT is looking like a sympathy play off of UBERs breakout today. It may be lagging and will follow the flag breakout the same way uber did. If breakout holds look for 55 as target.


$LYFT on a break out? The chart has all the chart indicators one could hope for.
The stock is prone to news and I am wary, watching, and ready to pick up call options.

$LYFT - golden cross is coming This could make a golden cross next week.
It had some negative news and I was stopped out of an option i picked up.
I may reenter if it can break the resistance at $49.15

LYFT over 50.79Consolidation box here looks ready for a move higher. Can benefit from economy reopening news.

$LYFT - golden cross$LYFT golden cross coming soon. It is a pattern I enjoy playing. No chart pattern or chart indicator is a guarantee.
Golden crosses on the horizon (within 1-35 days)
AA - I want in, but afraid
BAC
BOX
CARS
DBX
GE - Im in
HAS - Im in
LYFT
MLHR
MMM - Im in
NTAP
NTR - Im in
URG
WB
NNDM - Im in
ADS
BA
C
CONN
COTY
CRON
CSCO
EBIX
GNUS
JWN
M
MIXT
MO
NCLH
PSEC
SPG
UAL
WTFC
SPYD
EEFT
FNB
BNS
PRTH
YELP
RESN
Recently golden crossed and no where near entry or entry is still good to play the golden cross
OLN
RVLV
AXP
IMMR - Im in
DFS
EXPE
F - Im in
FBC
FCEL - Im in
IDEX
JPM
MET
MOS
STT - Im in
ULTA
WEX
Personal plays and cashed out today on golden cross:
IDEX +50%
MET +27%
ULTA +18%


$LYFT: Taking a LYFT back to the gapHey there! This is my short-term analysis for $LYFT, feedback is appreciated!
My Reasoning:
# RSI is overbought.
# Elliot Waves: EW counts are subjective - some could count X amount of waves and some will count Y amount of waves. IMO we are on the 5th wave, but I could also see people saying we are on the 3rd Wave. Nonetheless, a corrective wave could follow.
# LYFT has fully recovered back to the channel it was housed in before COVID - Going above this channel (resistance) even though the company is still having a very hard time seems unlikely to me.
# Approached a major resistance (Pre-Covid Resistance) and momentum seems too exhausted to break it.
# MACD just turned Bearish.
# Huge gap with potential to be filled? Also, the gap is located just below wave 4 - and the ABC corrective waves typically fall below wave 4.
Have a great weekend.


Bearish divergencePlease note: I'm just sharing my view. its not a recommendation for buying or selling.

LYFT Primary Trend Reversal signs(1W Timeframe)
Several clues point at the same outcome: reversal trend and Bullrun incoming!
- We can see a break of the downtrend with higher lows that will invalidate the bear market if we can close this W with a higher high. Keep in mind that there's a big resistance zone (red zone) that could push the price down to the yellow zone.
- 50 ema already crossed the 200 ema (daily time frame)
- RSI increasing to almost overbought and getting out of the bear zone (30-50) to the upper part, hopefully, it'll stay above 50.

LYFT Ready for Lift Off?LYFT has had nice earnings this year, and from a technical perspective is looking bullish according to the charts. We'll see if it has the strength to break above the $41.50 resistance and make a move towards $48 - $50.

LYFT LYFT OFF Fundamentals :
-Unprofitable ride sharing company that got beaten in stock so bad that it's good (for buyers. Why do I say this? When there's so much FUD and stock prices get beaten so bad, weak hands are out and only true believers remain holding the bag. When an uptrend occurs , these believers don't sell hence it only goes up and up)
-Earnings actually showed improvement this time
-A lot of the price decline was due to constant fud + law suits of contractors vs employee - the win which was awarded to lyft = price growth
Technicals:
Trend Analysis:
-Clear upwards trend on weekly. Reversed to Lower highs and higher highs.
-200 Daily SMA GOLDEN cross with 50 SMA
-20/50 Weekly SMA about to have a golden (most definitely will)
- Tom Demarks weekly continuation
- Breaking above parallel lines
- RSI MACD positive
Are you gonna let it LYFT off with? or without you?

Long on LYFTCould the price maintain above resistance become support at $48.98? If so, the next resistance would be $54.65.
