MSFT HAGIA SOPHIA! Self-explanatory, I think. Never trust motivational moves! They fade faster than a New Year's resolution! Yet we all fall for it all the time. The difference is we don't bet our hard-earned money every time we get motivated to learn our lesson after about the fifth or sixth or seventh... time!
For some reason, in trading, it's different; most don't even learn after the hundredth time! I am guessing it has something to do with the herd mentality. Others are doing it so its okay for me to lose my ass with them for the one hundredth and one time chasing!!
If I haven't convinced you yet, NOT to do it. Try thinking of it like this. There are many better trades out there to buy!
Hagia Sophia is not there to make you rich! It is there to humble you!
Click boost like and subscribe! l3ts get to 5,000 followers! ))
MSF trade ideas

Microsoft (MSFT) Share Price Jumps Nearly 9% – What’s Next?Microsoft (MSFT) Share Price Jumps Nearly 9% – What’s Next?
As the chart shows, Microsoft (MSFT) shares surged sharply, forming a large bullish gap: while trading closed around $391 on 30 April, yesterday’s candlestick closed just below the $425 mark.
What Drove the Rally in Microsoft Shares?
Microsoft released its financial results for the first quarter of 2025, exceeding Wall Street expectations on both revenue (actual = $70.1 billion, 2.4% above forecasts) and earnings per share (actual = $3.46, 7.4% above forecasts).
Particular attention was drawn to the strong performance of Azure – revenue from Azure and other cloud services soared by 33% year-on-year. A significant part of this growth was fuelled by robust demand for artificial intelligence services, which helps ease concerns about the return on large-scale infrastructure investments related to AI.
In addition, Microsoft issued an upbeat outlook for the next quarter, which ultimately triggered the sharp rise in its share price.
Technical Analysis of MSFT Chart
Yesterday’s candlestick closed near its low (highlighted by the arrow), indicating that bears were active during the trading session. From a technical analysis perspective, this can be explained by the proximity of the price to two key resistance lines:
1 → The upper boundary of a descending channel drawn from significant price action patterns (marked in red). The relevance of this channel is confirmed by the price’s behaviour near its median line (dashed).
2 → A former trendline that served as support throughout 2024.
Therefore, a short-term correction cannot be ruled out following the sharp rally in MSFT shares, potentially tempering some of the enthusiasm generated by Microsoft’s strong quarterly report.
This article represents the opinion of the Companies operating under the FXOpen brand only. It is not to be construed as an offer, solicitation, or recommendation with respect to products and services provided by the Companies operating under the FXOpen brand, nor is it to be considered financial advice.

MSFT is a no Brainer CALLMarket Context NASDAQ:MSFT
Current Price: $428.50
1-Month Move: +6.2% (from $403.20)
1-Year Move: +28.4% (from $333.80)
Year High/Low: $468.35/$309.45
Technicals:
RSI: ~63.2 (neutral, approaching overbought)
Above 20-day and 50-day MAs, slightly below 200-day MA (short-term strength in a longer uptrend)
Options Data:
IV Rank: 68th percentile (elevated premiums)
Put/Call Ratio: 0.85 (slightly bullish skew)
Max Pain: $415.00
High OI: $420 calls, $400 puts
Historical & Model Insights
Historical Move: MSFT averages ~5.8% post-earnings, with 7/12 quarters showing upside.
IV Crush: Expect 25–35% IV drop post-earnings, so plan exits carefully.
Model Consensus (Grok, Claude, Llama, Gemini, DeepSeek): Moderately Bullish
Why? Strong AI/cloud growth narrative, consistent guidance beats, and call-heavy OI at $420–425. Max Pain at $415 suggests limited downside pull.
Outlier: Gemini flags macro risks and Max Pain gravity, leaning neutral but not bearish.
Trade Setup
Strategy: Single-leg, naked call (bullish, defined risk)
Instrument: MSFT
Direction: Call
Strike: $435.00 (premium $0.75, fits $0.50–$1.00 target band)
Expiry: 2025-05-02 (first weekly post-earnings)
Entry Price: $0.75
Entry Timing: Pre-earnings close (2025-04-30)
Profit Target: $1.50 (~100% gain)
Stop Loss: $0.38 (~50% loss)
Confidence: 70%
Expected Move: ±$24.90 (~5.8%)
BEST AI Signals in the market

Bitcoin Vs Microsoft 🚨MartyBoots here , I have been trading for 17 years and sharing my thoughts on COINBASE:BTCUSD .
🚨
.
NASDAQ:MSFT vs COINBASE:BTCUSD
Do not miss out on COINBASE:BTCUSD as this is a great opportunity. You are still early
Watch video for more details

Microsoft - Positive earnings expectation , value to collect?Hi guys we would be looking forward to our next stock analysis for Microsoft!
Microsoft Corporation continues to demonstrate robust financial performance, underpinned by its strategic investments in artificial intelligence (AI) and cloud computing. The company's strong earnings and forward-looking initiatives position it favorably for sustained growth.
In Q4 FY2024, Microsoft reported revenue of $64.7 billion, marking a 15% increase year-over-year. Net income rose to $22.0 billion, with diluted earnings per share (EPS) of $2.95, surpassing analysts' expectations of $2.90 . For the full fiscal year, revenue reached $245.1 billion, reflecting a 16% increase, while net income grew by 22% to $88.1 billion.
Microsoft's Intelligent Cloud segment, which includes Azure, generated $28.5 billion in revenue for Q4 FY2024, a 19% increase year-over-year. Azure's revenue alone grew by 29%, driven by strong demand for cloud services and AI integration . The company's AI initiatives, such as the integration of Copilot across Microsoft 365 applications, have been pivotal in enhancing productivity and driving adoption.
📈 Positive Overall Outlook
Analysts maintain a bullish outlook on Microsoft's stock, with expectations of continued growth in earnings and revenue. For fiscal year 2025, analysts forecast an EPS of $13.04, up 10.5% from the previous year . The company's strategic focus on AI and cloud computing, coupled with its strong financial results, support this positive sentiment.
Microsoft's commitment to expanding its AI capabilities is evident in its planned $80 billion investment to enhance its global network of computing centers . This investment aims to support the growing demand for AI services and solidify Microsoft's position as a leader in the AI and cloud computing markets.
To summarize, Microsoft's strong financial performance, driven by its cloud and AI initiatives, positions the company for continued success in the evolving technology landscape.
📌 Trade Plan
📈 Entry: 390 -
✅ Target: 430 - Just below the ATH / around the strong resistance
❌ SL: 365 - Just around the current rejected support zone

Mircosoft LongWe are now net long on the regression break.
I am not taking this trades as it is only just a break and the market is volitile.

META & MSFT Daily Trade SetupsIn this update we review the recent price action in Meta & Microsoft ahead of their earnings release and identify the next high-probability trading opportunities and price targets. To review today's video analysis, click here!

MSFT Setup After EarningsEarnings season is heating up and Microsoft (MSFT) is once again in the spotlight. With its dominance in cloud and AI, the next move could be explosive.
Here’s how pro Im thinking my setting up:
🔹 $390 – A bold speculative entry for breakout hunters.
🔹 $365 – A defensive entry on post-earnings pullback to support.
🔹 $345 – The opportunity zone if a sharp drop offers value.
🎯 Profit Targets:
TP1: $410 – Psychological and technical resistance.
TP2: $426 – Momentum continuation level.
TP3: $445–$450 – Ambitious upside for long-term riders.
Whether you’re playing momentum or patiently buying dips, MSFT is offering clear levels. Stay sharp.
Disclaimer: This is not financial advice. All trading involves risk. Do your own research or consult a professional advisor before investing.

MSFT Q1 EARNINGSMicrosoft Earnings Presentation. We have a strong resistance area that we need to break. If we break through that area, we would move toward the second resistance zone, with strong support at 355.
If MSFT report strong earnings, the stock could move toward the $420 area, where it reached during the last earnings release.

Microsoft in Focus Ahead of Key Earnings, AI Outlook Under WatchMacro:
- Microsoft (MSFT) climbed on cautious optimism ahead of major earnings and economic data.
- Four of the “Magnificent Seven,” AMZN, AAPL, META, and MSFT, are set to report, with investors focusing on Microsoft (MSFT) today.
- Wall Street expects EPS of 3.22 USD and revenue of 68.44 B USD, both up YoY. Microsoft’s strength in AI, cloud, and enterprise software, along with its continued investment in AI talent and solid dividend history, makes this a closely watched report.
- Key drivers will be its results, AI/cloud growth outlook, and forward guidance, while any surprises could shift the stock sharply.
Technical:
- MSFT recovered and tested the resistance at around 396, confluence with EMA78. The price is sideways, and we await a clearer breakout to determine the following direction.
- If MSFT breaks above 396, the price may approach the following resistance at 405, confluence with the 100% Fibonancci Extension.
- On the contrary, remaining below 396 may prompt a retest to the support at around 378, confluence with the broken descending channel.
Analysis by: Dat Tong, Senior Financial Markets Strategist at Exness

April 29 Trade Journal & Stock Market AnalysisEOD accountability report: +686.25
Sleep: 8 hour, Overall health: :thumbsup:
Overall a decent day, but signals felt iffy today.
**Daily Trade Signals based on VX Algo System**
— 10:00 AM Market Structure flipped bullish on VX Algo X3!
10:27 AM VXAlgo ES X1 Sell Signal (double signal) :x:
1:08 PM Market Structure flipped bearish on VX Algo X3! :x:
1:51 PM Market Structure flipped bullish on VX Algo X3!
— 2:20 PM VX Algo ES X1 Sell Signal :x:
— 3:38 PM VXAlgo ES X3 Sell Signal (Double signal)
Next day plan--> Over 5470 = Bullish, Under 5470 = Bearish
Video Recap -->https://www.tradingview.com/u/WallSt007/#published-charts

Trading Analysis for Microsoft**Current Price:** $387.3
**Direction:** **LONG**
**LONG Targets:**
- **T1 = $395.0**
- **T2 = $405.0**
**Stop Levels:**
- **S1 = $383.0**
- **S2 = $376.0**
---
**Wisdom of Professional Traders:**
This analysis synthesizes insights from thousands of professional traders and market experts, leveraging collective intelligence to identify high-probability trade setups. The wisdom of crowds principle suggests that aggregated market perspectives from experienced professionals often outperform individual forecasts, reducing cognitive biases and highlighting consensus opportunities in Microsoft.
**Key Insights:**
Microsoft is demonstrating robust growth potential, particularly buoyed by its increasing investments in AI infrastructure and cloud computing services. Traders see the stock primed for a continuation of its upward momentum due to growing demand for AI applications across industries and Microsoft’s advancements in integrating AI technology into its product ecosystem. Institutional confidence remains high, with analysts highlighting key drivers such as Azure's market share expansion and strong profitability metrics.
Near-term momentum ahead of earnings is supported by key technical indicators and market sentiment. Resistance at $390 and psychological levels around $400 are being closely monitored by traders. Sustaining movement above these levels could lead to further upside potential that traders are ready to capitalize on.
**Recent Performance:**
Microsoft's stock has been outperforming many peers in the tech sector, consistently trading above its 20-day and 50-day moving averages. This indicates short-term bullish momentum, though it has struggled to break above its 200-day moving average. The consolidation phase observed recently suggests that market participants are awaiting pivotal news such as earnings results to initiate significant directional moves. A notable surge in buying interest has also been seen across its options market, signaling optimism among institutions and retail investors alike.
**Expert Analysis:**
Analysts have been praising Microsoft's execution in fulfilling long-term AI strategies, which could potentially add billions to future revenue streams. Growth in cloud services led by Azure and partnerships with OpenAI further underline the company’s strategic edge in the evolving tech landscape. Technical indicators like RSI and MACD also signal bullish sentiment, with key support levels well-defined at $376 and $383, safeguarding downside risks. Many experts agree that a robust quarterly earnings beat or upward revision of guidance could ignite momentum toward the $405-$413 range.
**News Impact:**
Anticipation is building ahead of Microsoft's earnings announcement, where traders are expecting a strong beat on both revenue and EPS metrics. Positive sector-wide developments in generative AI, alongside broader macro trends benefiting tech, have left investors optimistic about the stock's prospects. Any updates on Microsoft's AI-driven initiatives or its integration into major product lines could significantly impact future share price movements. Additionally, the regulatory environment around AI technologies is being closely monitored as it could influence long-term valuations.
---
**Trading Recommendation:**
Microsoft is well-positioned for long-term bullish momentum, with near-term upside heading into its earnings report. Clear support levels are established at $376 and $383, providing safety nets for traders while resistance levels of $395 and $405 present opportunities for potential gains. This setup aligns with expert analysis and institutional sentiment, making a LONG trade favorable for those seeking an entry point into a high-performing tech giant with strong fundamentals.
```

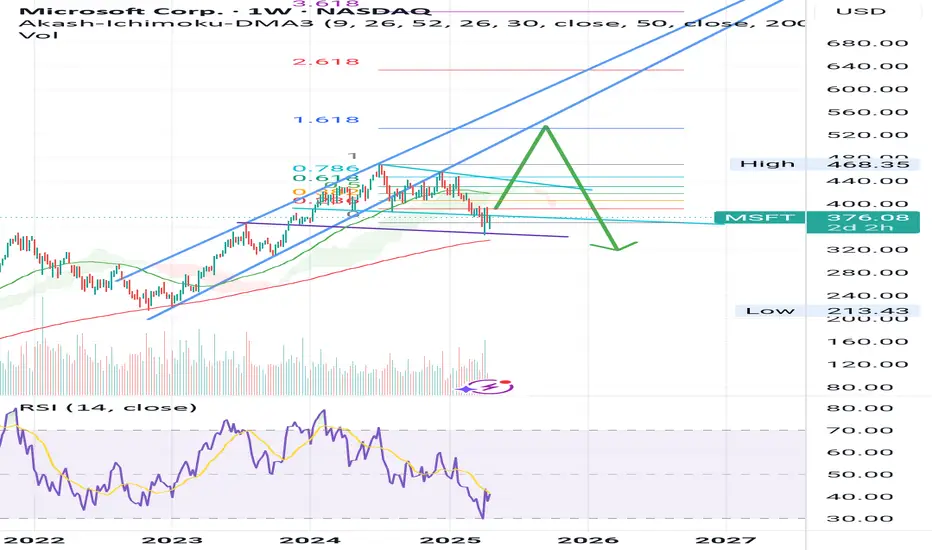
$MSFT : A 'Teflon' stock refusing to budge under pressureI promised multiple times that a detailed analysis of NASDAQ:MSFT will be published. Its time, today we analyze the levels to watch for and the future price points in this stock.
A large cap stock like NASDAQ:MSFT is a difficult ship to navigate. During the recent turbulence the stock lost almost 33% of its value. Even during these times, it never broke below the prior cycle highs of 345 $ in contrast to other MAG7 stocks like NASDAQ:TSLA which then led to more than 50% downturn in the stock. But as the headline says NASDAQ:MSFT is Teflon stock with resistance to go down. In the weekly chart we see that the stock never broke below the midpoint of the upward sloping regression band channel which is @ 375 $.
Now where does the stock go from here? If we plot the Fib levels on NASDAQ:MSFT we see that it is firmly at 0.382 which lies at 392 $. Next level is at 415 $, and we have an earning catalyst upcoming for NASDAQ:MSFT and if the stock closes above 425 $ then we can easily touch 422 $.
Verdict : NASDAQ:MSFT keep on DCAing. Earnings quality with low volatility.

MSFT Downtrend Over?Gray support is holding the price drop.
Yet, in my primary count, I´m still considering this is blue 4 correction.
Statistically, wave C usually ends with divergence, and we don't see it on the daily or the 4H timeframes.
So, I'll stick to this count as long as price stays below wave 1 (412.29).

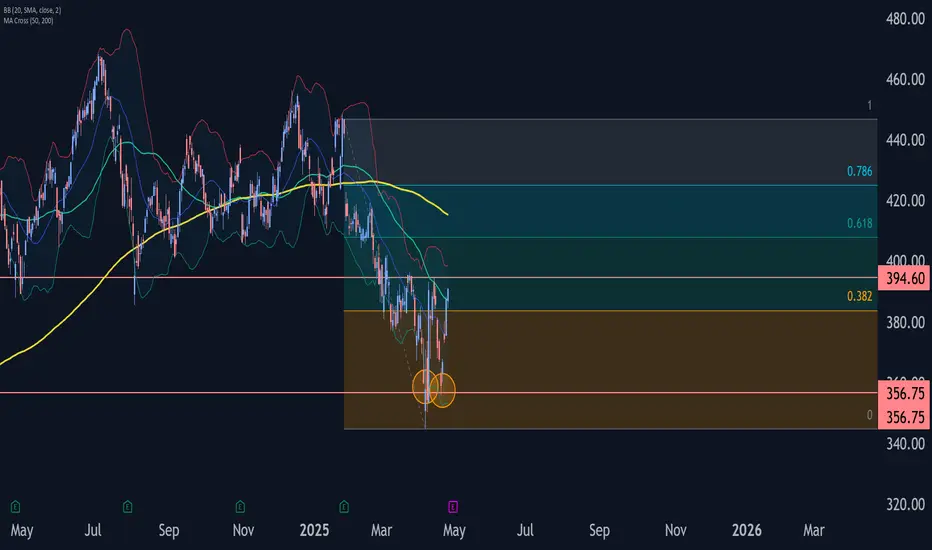
Microsoft Wave Analysis – 25 April 2025
- Microsoft rising inside impulse wave i
- Likely to test resistance level 394.60
Microsoft continues to rise inside the minor impulse wave i which started earlier from the support area between the key support level 356.75 and the lower daily Bollinger Band.
The active impulse wave i belongs to the c-wave of the ABC correction 2 from the start of April.
Microsoft can be expected to rise toward the next resistance level 394.60 (which reversed the previous waves iv and a).
Microsoft's Downtrend Poised for Deeper RetracementsMSFT 4D TECHNICAL ANALYSIS 📉
OVERALL TREND
📉 DOWNTREND — Confirmed by the descending pivot structure, cluster of recent lower highs, and bearish rejection from the 430–455 zone. The downtrend is confirmed with a moderately confident score of 23.8%, with a Trend Score of -0.50.
🔴RESISTANCE ZONE
🔴 468.3500 — SELL STOPLOSS | PIVOT HIGH
🔴 455.7494 — SELL ORDER 2
🔴 430.2472 — SELL ORDER 1
🎯ENTRIES & TARGETS
🎯 381.6944 — SELL ORDER & | TP 1
🎯 340.8905 — SELL ORDER & | TP 2 | MID-PIVOT
🎯 310.8399 — SELL ORDER & TP 3
🎯 264.4180 — EXIT SELL & TP 4
🟢SUPPORT ZONE
🟢 253.2621 — BUY ORDER 1
🟢 226.1769 — BUY ORDER 2
🟢 213.4130 — BUY STOPLOSS | PIVOT LOW
✍️STRUCTURAL NOTES
Major lower high rejection seen near 455–468 zone—clearly defined by the last bullish failure to break above
Recent candles show moderate bullish defense near 380, but unable to create a higher high
All key short-term MAs (10–50) are bearish, with crossover confirmation stacking downward
Longer-term moving averages (100–200) show mixed signals; short-term selling strength remains dominant
Oscillators show mixed-to-weak bearish signals, with MACD and Awesome Oscillator suggesting negative momentum
📉TRADE OUTLOOK
📉 Bearish Continuation Bias with potential downside continuation toward TP3 @ 310.84 and TP4 @ 264.41
📈 Temporary bounce possible at 381.69–340.89 range, but expected to be corrective unless higher highs are confirmed
🔍 Watch for retest and rejection at 430.24 or 455.74 zones to validate reentry setups on the short side
🧪STRATEGY RECOMMENDATION
CONSERVATIVE APPROACH (Trend-Following):
— Entry: 381.69 (on rejection confirmation)
— TP: 340.89 / 310.84 / 264.41
— SL: Above 430.25
AGGRESSIVE REVERSAL PLAY:
— Entry: 253.26 (Buy Order)
— TP: 310.84 / 340.89
— SL: Below 213.41
“Discipline | Consistency | PAY-tience™”

MSFT is losing key levelsMicrosoft has lost some very important support levels. After falling by 10%, it rebounded to the former support area, which is now acting as resistance. Many investors took advantage of this move to exit at a better price than we saw recently. Unless the stock moves back above this level, the outlook for MSFT remains bearish, and we may soon see further surprises in the US tech sector.

MSFT NeutralFundamentals
- Large float and mega cap - insufficient potential for move
- Revenue growing for slowly
- EPS is expected to decrease
- P/E 30 which is acceptable for Growth stock but MSFT is more already value stock and historically has lower P/E 23
Technicals
- Trying to reverse with the market but overal stock looks less interesting
Not so cheap compared to alternatives, above center of Yearly ATR
Better await drop.
Entry
- 300
Stop
- 250
Take
- 400

MSFT at a Decision Zone – Bulls Trying to Take Control!Options GEX Outlook (04/22/2025):
* Current Price: $373
* IVR/IVX: 55.6 / 39.4
* Options Sentiment: PUTs 19.4% (moderately bearish but not extreme)
* GEX Walls:
* Support (PUT Wall): $352.50 (Highest negative NETGEX)
* Resistance (CALL Wall): $380 (69.1% GEX) – this is the most meaningful upside wall
* Implication: MSFT is hovering just under a high-interest gamma zone at $377.5–380. Option sellers may defend this area, making it sticky and resistant. However, if bulls can break and hold above $380, gamma flip pressure could fuel continuation toward $390.
Technical Analysis + Scalping Bias (1H + SMC Co-Pilot):
* HTF SMC Bias (15min): Bullish structure forming, but not fully aligned.
* Trend Strength: Weak to Mixed — price is reacting, but structure lacks full confluence.
* Market Structure: No clear BOS or CHoCH yet, indicating the need for a clean break before committing.
* Volume: Strong Momentum Spike (1.25x) supporting this bounce.
* RSI, MACD, BBP: All Bullish, indicating price strength, but no defined setup yet.
* EMA/VWAP Reaction Zone: Currently testing EMA9 and watching for confirmation.
* Strength Meter: ⚠️ Mixed bias — 2/5 score.
Trade Thoughts:
* Above 374–377.5: This is the short-term battleground. If MSFT can hold this area with volume support, it may move toward the 380–385 gamma wall.
* Below 367.5: Breakdown of this level would invalidate bullish bias and shift momentum back toward 360–355.
* No Clear Trade Yet: You're in a zone of indecision. Scalpers should wait for CHoCH + BOS or break of EMA support to lean into a direction.
Action Plan:
* ⚠️ Stay Patient — Wait for a clean structure shift (BOS/CHoCH) above 377.5.
* ✅ Watch Volume — Sustained volume could confirm a breakout.
* 🔁 Key Levels to Monitor: 367.5 (support), 377.5–380 (gamma wall resistance)
Conclusion:
MSFT is testing resistance near key option gamma walls. Structure is building, but lacks confirmation for a clean entry. If it clears 380 with volume and structure support, the breakout could get legs. For now, manage risk and wait for confirmation.
This analysis is for educational purposes only. Always do your own research and manage your risk before trading.

Microsoft Wave Analysis – 18 April 2025
- Microsoft falling inside impulse wave 5
- Likely to test support level 360.00
Microsoft continues to fall inside the minor impulse wave 5, which started recently from the key resistance level 392.50 (which also reversed the price at the end of March) standing close to the 50% Fibonacci correction of the downward impulse from January.
Impulse wave 5 is a part of the strong multi-month downward impulse sequence (C) from last December.
Given the clear daily downtrend, Microsoft can be expected to fall to the next support level 360.00, which reversed the price at the start of April.

MSFT: Long viewMSFT is a great stock, consistently and impressively growing in recent times, I really like it, and this is a great opportunity to .... SELL.
Distribution phase!
.
Lets wait for good entry!

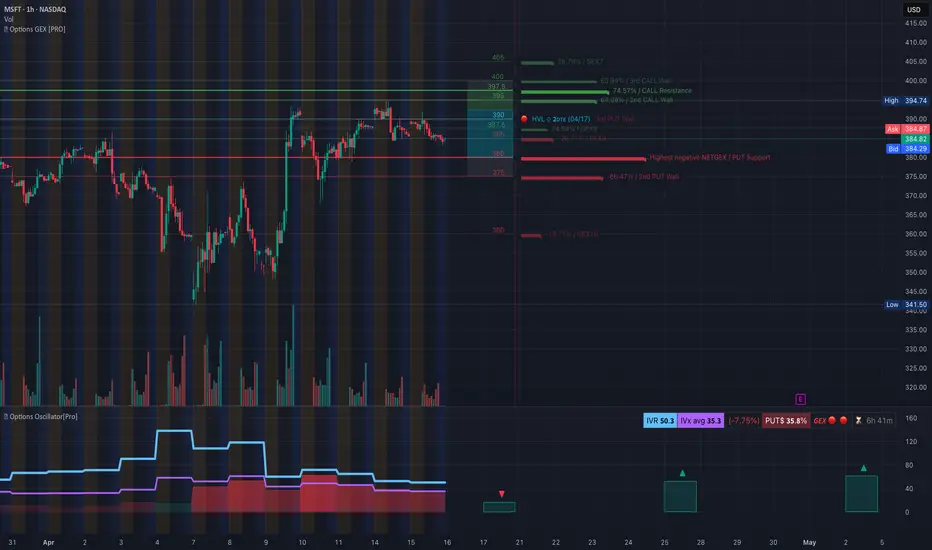
MSFT GEX Breakdown: Heavy PUT Signals Danger Below 380!🔮 Options GEX (Gamma Exposure) Insights – MSFT:
🟥 PUT Domination Increasing
* Highest negative GEX sits around 380–375, making this a critical gamma support zone where dealers are heavily hedged long gamma.
* If MSFT breaks below 380, expect amplified sell pressure as dealers adjust hedges, possibly triggering a quick flush to 360, where another GEX wall sits.
🟩 CALL Walls Stack at Resistance
* CALL Walls are stacked between 395, 397.5, and 400, forming a firm gamma ceiling.
* The highest positive net GEX resides near 395–400, making upward movement difficult unless IV spikes and hedging flips.
📉 GEX Sentiment Summary:
* IVR: 50.3 → Volatility expectations remain moderate.
* IVx: 35.3, trending –7.75% lower, suggests option pricing is cooling — but this can rapidly reverse if support fails.
* PUTs dominate at 35.8%, implying dealers are short gamma and could accelerate moves if price breaks either direction — especially down.
🎯 GEX Game Plan:
* Below 380: Watch for a sharp selloff toward 375, then 360 if flow intensifies.
* Above 390: Limited upside until 395–400 clears — CALL resistance is thick, expect rejection unless news or volume surge.
🕰️ Technical Analysis – 1H Chart (Supports the GEX View)
* Trendline Breakdown: Price has slipped below a rising wedge, and EMAs are flattening out — bearish.
* VWAP Rejection: Price is struggling under VWAP, showing institutional sell pressure.
* MACD: Flat but negative, trending under zero — no momentum shift yet.
* RSI: Below 45 and falling — still no divergence or strength building.
Support/Resistance Key Levels:
* Support: 380 (first GEX wall), 375 (heavy PUT support), then 360 (final wall).
* Resistance: 390 (VWAP area), 395–400 (dense CALL walls).
🧠 Final Thoughts:
MSFT is coiling near a high-risk gamma zone. With dealers holding heavy short gamma below 380 and no clear bullish reclaim on the chart, downside remains open. Bulls need to reclaim 390+ fast — or risk a gamma-led liquidation flush to 375 or lower.
This is a GEX-driven chart — the technicals merely confirm what options flow already warns: the path of least resistance is likely down, unless a surprise reversal ignites above 390.
This analysis is for educational purposes only and not financial advice. Always manage risk and confirm setups with price action.