NDAQ - Expanding channel patternSymetrical Channel up broke up at june'12 and aug'15
this broke up trigger ascending channel pattern, as correction type pattern.
As we can see small ABCD fibonacci retracement pattern perform with target at 1.1618 around .382 major trend fibs.
this is a good level to enter long with target at B expanding pattern.
Disclaimer :
This analysis not include personal feeling/opinion, and pure base on technical analysis
Trading foreign currencies/stocks can be a challenging and potentially profitable opportunity for investors. However, before deciding to participate in the market, you should carefully consider your investment objectives, level of experience, and risk appetite. Most importantly, do not invest money you cannot afford to lose.
NAQ trade ideas

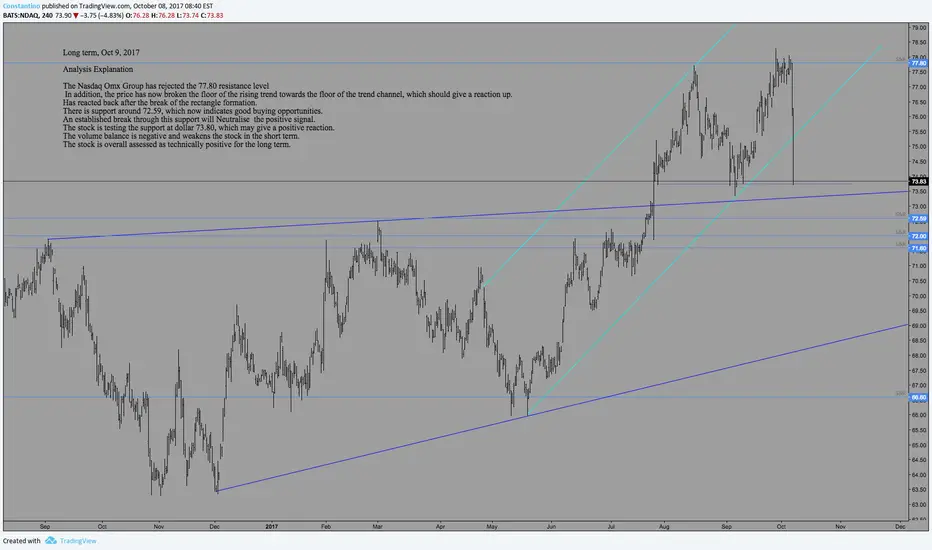
Nasdaq H4 Technical Analysis Oct 9, 2017
Analysis Explanation
The Nasdaq Omx Group has rejected the 77.80 resistance level
In addition, the price has now broken the floor of the rising trend towards the floor of the trend channel, which should give a reaction up.
Has reacted back after the break of the rectangle formation.
There is support around 72.59, which now indicates good buying opportunities.
An established break through this support will Neutralise the positive signal.
The stock is testing the support at dollar 73.80, which may give a positive reaction.
The volume balance is negative and weakens the stock in the short term.
The stock is overall assessed as technically positive for the long term.
Very Much Appreciate your Likes and Commends
Trade Safely


Nasdaq - some bearish divergence on monthly RSII've circled in yellow some bearish divergence on the Nasdaq . notice the overall similarity in structure of the recent pattern to the pre-crash of 2008. I would be watching this closely, but I'm yet to call this a big short due to the relatively small amount of bearish divergence this time around when compared to pre-'08 crash. if anything negative does happen, it will likely be a smaller correction when compared to '08.


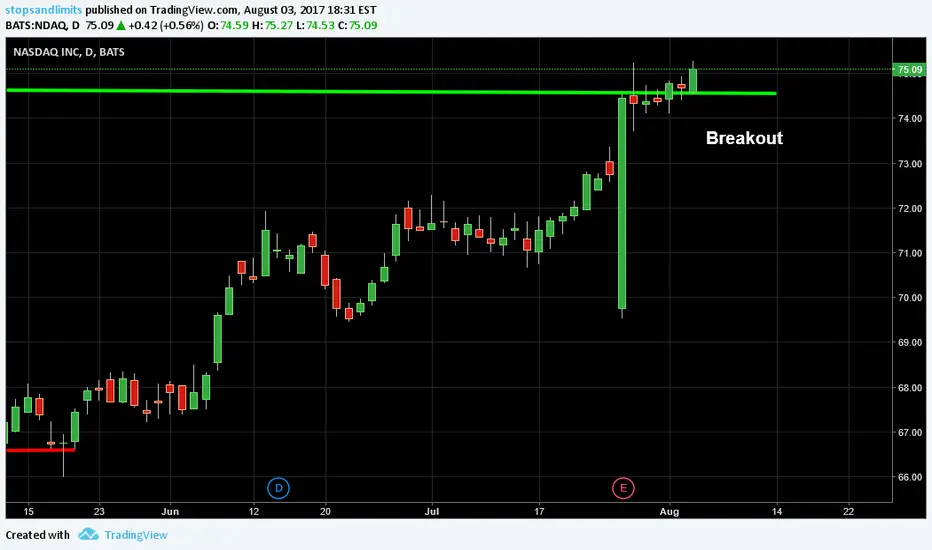


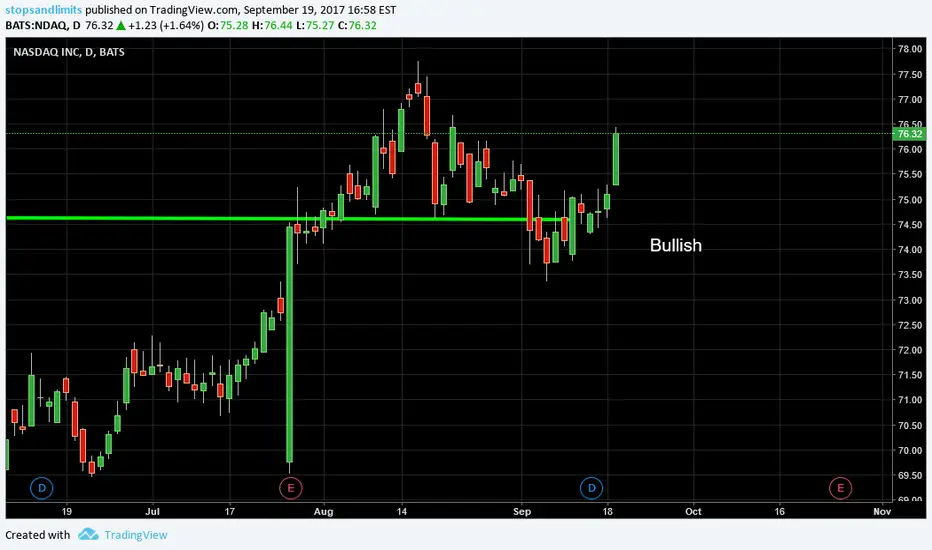
12/06/2017 NASDAQ AnalysisPrice has rebounded in the resistance level.. A double top pattern is starting to appear.

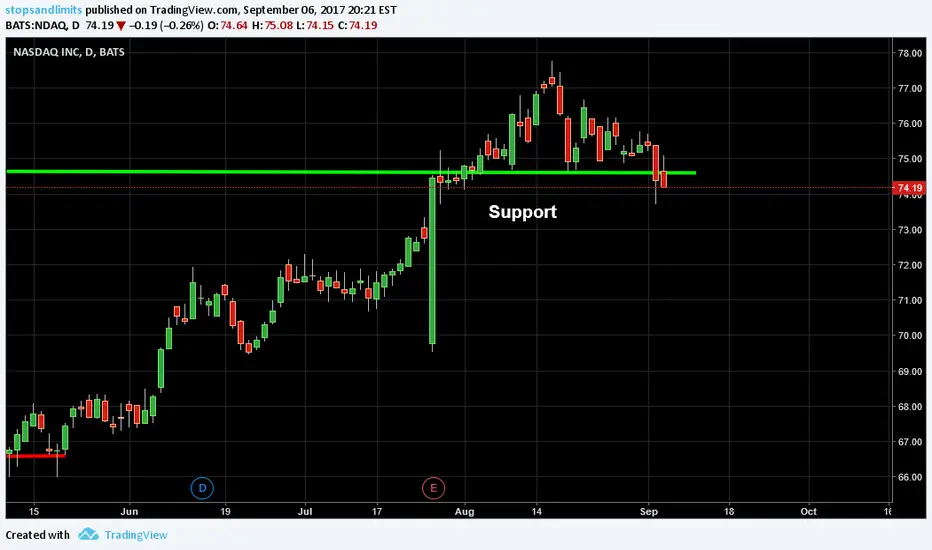
9/06/2017 NASDAQ AnalysisPrice has come with a bearish candle at a high level, which marked the beginning of a bearish trend.

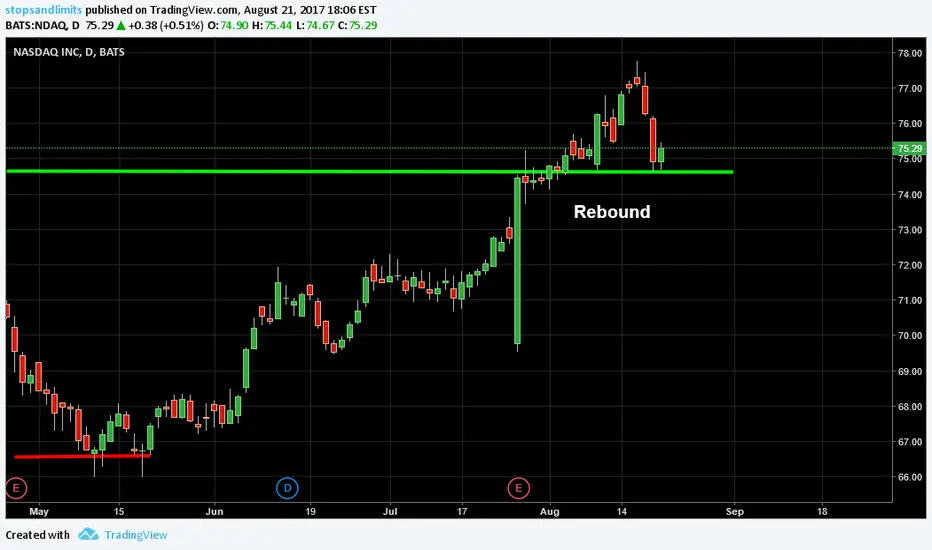
19/05/2017 NASDAQ AnalysisPrice has rebounded for the second time in the level of support generating a pattern of double bottom.

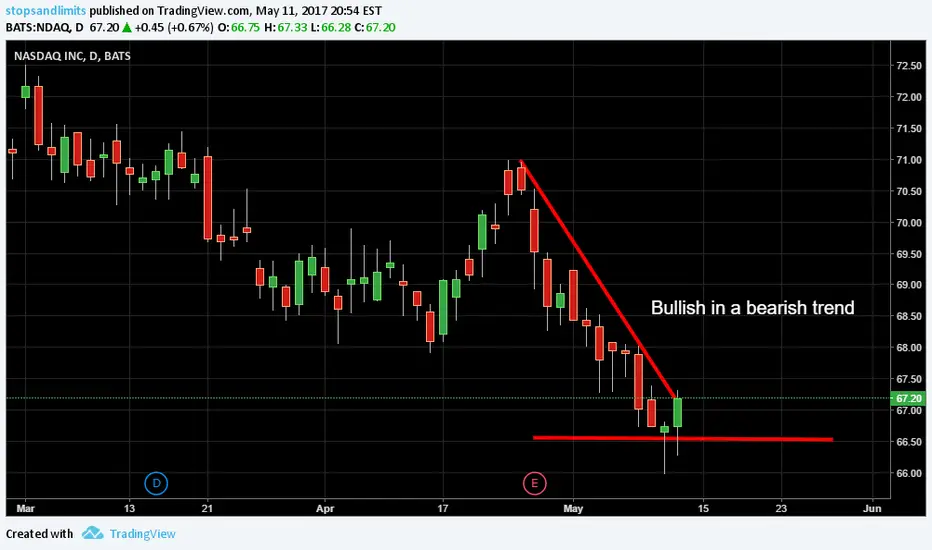
11/05/2017 NASDAQ AnalysisThere is an increase in price for two consecutive days, after a strong bearish trend. Possible reactivation of the bearish movement, but be pending a turn in the trend due to a rebound in a new level of support.
9/05/2017 NASDAQ AnalysisThe price of the index has maintained a strong downward trend, which began on April 24. Wait for a weakening trend.

