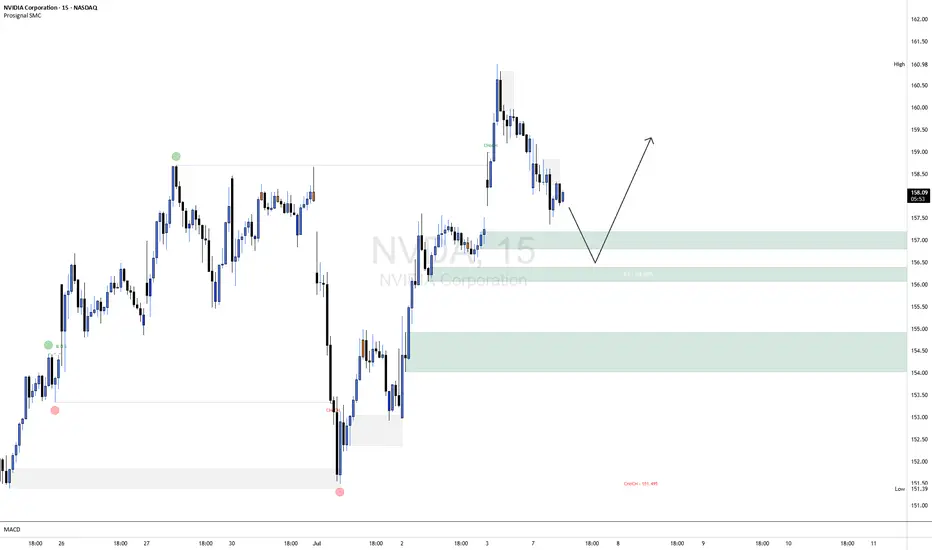
NVDA Analysis To 164?Quick breakdown of NVDA
Appears we hit our corrected level, we could go deeper possibly or hold at this level and drive up to 164
This is looking like a nice little setup long indeed
Trade Smarter Live Better
Kris/Mindbloome Exchange
NVD trade ideas

NVIDIA (NVDA)-Trade PlanNVDA, After an explosive run powered by GenAI infrastructure and bullish earnings, the chart is setting up for either a bullish continuation or a healthy pullback.
With volatility tightening and volume compressing, this is a great moment to prepare for either breakout or breakdown scenarios.
🎯 Trade Plan – Tiered Long Setup
📌 Entry Zones (Tiered Buying):
🔹 $150
🔸 $140
🔻 $120
📈 Profit Targets:
TP1: $160
TP2: $175
TP3: $200+ – Long-term continuation play if AI macro momentum persists
📌 DISCLAIMER: This idea is for educational purposes only. Always use proper risk management and assess your own strategy

NVDA at a Make-or-Break Zone – Trade Setups Ahead 🔍 Options GEX Insights (Gamma Exposure):
* GEX Map Observation:
* NVDA is currently trading near 158, slightly under the major Gamma Wall at 160.98.
* This level marks the highest positive net GEX – strong resistance due to heavy call positioning.
* Above that, additional call walls stack at 162.5 → 165 → 167.5, creating a squeeze zone if price breaks out.
* Below, support levels sit at 155 (2nd PUT wall) and 152.5 (3rd PUT wall).
* Volatility & Options Sentiment:
* IVR: 8.8, IVx: 40.8 – low implied volatility rank = cheap options.
* Put Positioning: Only 1.4% = call-heavy environment, skewed bullish.
* Positive GEX (+) across expiries shows dealers will hedge upward if we move beyond 161.
🟢 Bullish Scenario (Breakout/Squeeze Setup):
* Break over 160.98 could ignite a gamma squeeze toward 165–167.5 range.
* Ideal for low delta CALL verticals or debit spreads targeting the 165 zone.
* Weekly options are cheap due to low IV.
🔴 Bearish Rejection Scenario:
* If price stays pinned under 160 and loses 155, dealers start to de-hedge – momentum toward 152/150.
* Consider put spreads or a cautious fade if it breaks structure.
📌 GEX Summary Suggestion:
If NVDA stays under 160, price may remain pinned or retrace. But above 161 opens the gamma doors to 165+. Cheap IV = opportunity.
📊 1-Hour Price Action Technicals:
* Market Structure:
* Previous BOS toward the upside has stalled inside a consolidation box under 160.
* Multiple CHoCH zones form below current price, hinting at exhaustion.
* Price is stuck within a wedge, coiling beneath resistance = compression phase.
* Support & Resistance Zones:
* Resistance: 159.34 → 160.98 (Gamma Wall and price supply).
* Support: 155.34, then 151.10.
* Bullish OB remains untested around 151 area if price flushes.
* Volume & Trend:
* Volume declining during chop = balance phase.
* RSI & MACD show slight bearish divergence, favoring caution near top of range.
⚙️ Trade Thoughts:
* Scalp Setup:
* Above 160.98 = scalp long toward 162.5/165, tight stop at 159.3.
* Below 155 = scalp short toward 152 zone.
* Swing Setup:
* Long only on strong breakout close above 161 with volume.
* Short swing possible under 155 if CHoCH confirms trend flip.
Conclusion:
NVDA sits at the pivot point of either breaking out toward 165+ or rejecting and retracing toward 152. GEX and price both hint at a coiled move ahead. Stay nimble, follow the volume.
Disclaimer: This analysis is for educational purposes only and does not constitute financial advice. Trade at your own risk.

NVDA ShortNVDA is currently exhibiting short-term bearish order flow on the 15-minute chart, with price making lower highs and lower lows following a clear CHoCH (Change of Character) to the downside. The current leg suggests continued weakness as price retraces toward the highlighted bullish order block around the 156.20–157.00 range, aligning closely with the 50% equilibrium level of the last bullish impulse.
This area represents a high-probability demand zone where we anticipate a potential bullish reaction. A confirmation entry (e.g., bullish BOS or lower timeframe CHoCH within the OB) will be required to validate a long setup from this zone. Should confirmation present itself, upside targets can be trailed back toward recent highs near 159.00–160.00.
Risk Management Note:
Always wait for confirmation before entering against the prevailing short-term trend. Use a well-defined stop-loss below the order block and calculate your position size based on your overall risk tolerance (typically 0.5–1% of account equity per trade). Avoid overleveraging, and remember that patience and discipline are key to capital preservation.
(NVDA) Long Pre-Market position off of previous support. Should wick down, grab liquidity then continue upwards.

How To Spot The Breakout In 3 Steps Or More..In this video we dive into how to spot the breakout
but here is a catch we are using the Stochastic RSI
to spot these breakouts.
Also this spotting of these breakouts is happening
together with the Rocket booster
strategy.
Watch this video to learn more.
Disclaimer:Trading is risky please learn risk management and profit
taking strategies.Also feel free to use a simulation trading account
before you trade with real money.

NVIDIA NVIDIA (NVDA) CORP IS LEADING IN AI CHIPS
NVIDIA closed the week in a massive green candle at $159.34 , marking a new all-time high.
NVIDIA’s market capitalization is approximately $3.89 trillion, making it the world’s most valuable publicly traded company as of July 2025.
Financial Performance
Q1 Fiscal 2026 (ended April 27, 2025):
Revenue: $44.1 billion (up 12% quarter-over-quarter, up 69% year-over-year)
GAAP EPS: $0.76; Non-GAAP EPS: $0.81
Gross Margin: 60.5% (61.0% non-GAAP), impacted by a $4.5 billion charge related to US export restrictions to China
Fiscal 2025 (ended January 2025):
Revenue: $130.5 billion (up 114% year-over-year)
GAAP EPS: $2.94 (up 147% year-over-year)
Non-GAAP EPS: $2.99 (up 130% year-over-year)
Business Highlights
AI and Data Center Leadership:
NVIDIA’s explosive growth is driven by surging demand for its AI chips, especially in data centers. The company’s Hopper and Blackwell GPU platforms are in high demand, with Blackwell samples now shipping to partners and customers.
Robotics and Automotive Expansion:
Robotics is emerging as a major growth area. NVIDIA’s robotics and automotive division generated $1.7 billion in revenue last year, with projections to exceed $7.5 billion by the early 2030s. The company recently unveiled the AEON humanoid robot and continues to invest in platforms for autonomous vehicles and industrial automation.
Product Innovation:
At Computex 2025, NVIDIA announced new AI infrastructure technologies, including NVLink Fusion and the Isaac GR00T-Dreams platform for robotics. The company is also expanding into custom AI server solutions and ARM-based CPUs for PCs and servers.
NVIDIA remains moderately bullish, the Bullish scenarios/probability could potentially reclaim $200–$250 per share in 2025 if AI demand accelerates and China market headwinds ease.
Growth Drivers:
Continued AI adoption across industries
Expansion in robotics, automotive, and cloud infrastructure
Strategic partnerships and global supply chain investments
Recent News
Market Leadership:
NVIDIA briefly surpassed Microsoft and Apple to become the most valuable company in history, with a market cap nearing $3.92 trillion.
Dividend:
The next quarterly cash dividend of $0.01 per share was paid on July 3, 2025.
Summary Table
Metric Value (July 2025)
Stock Price $159.34
Market Cap $3.89 trillion
Q1 FY26 Revenue $44.1 billion
Q1 FY26 EPS $0.76 (GAAP), $0.81 (non-GAAP)
Fiscal 2025 Revenue $130.5 billion
Fiscal 2025 EPS $2.94 (GAAP), $2.99 (non-GAAP)
Dividend (Quarterly) $0.01/share
NVIDIA remains the global leader in AI and accelerated computing, with record financial results, a dominant market position, and ambitious expansion into robotics and next-generation computing platforms.
#NVIDIA #AI #STOCKS

NVDA Support and Resistance Lines Valid from July 1 to 31st 2025Overview:
These purple lines act as Support and resistance lines when the price moves into these lines from the bottom or the top direction. Based on the direction of the price movement, one can take long or short entries.
Trading Timeframes
I usually use 30min candlesticks to swing trade options by holding 2-3 days max. Anyone can also use 3hr or 4hrs to do 2 weeks max swing trades for massive up or down movements.
I post these 1st week of every month and they are valid till the end of the month.

NVIDIANVIDIA is due for correction, anytime it can start. This week probably would be a good week to start the correction.
Disclosure: We are part of Trade Nation's Influencer program and receive a monthly fee for using their TradingView charts in our analysis.

NVDA GEX Analysis for Options Trading. Jul 7Gamma Exposure (GEX) Insights – July 5, 2025
* 📍Key Gamma Wall (Resistance):
→ 160.98 — Highest positive GEX level (strong call wall / gamma resistance).
→ 162.5 — Next large call wall, acting as a magnet or rejection pivot.
→ 165 / 170 — Thin GEX above = squeeze zone if breakout occurs.
* 🧲 Support Side:
→ 152.5 – 150: HVL + Put Support + GEX pocket.
→ 140: Second PUT wall, deeper support if breakdown worsens.
* 📉 IV Sentiment:
→ IVR: 5.6, IVx avg: 37.9 = Low implied volatility.
→ Current IV crush environment favors debit call spreads or directional long calls with tight risk.
* 📊 Call/Put Flow:
→ Calls: 3.3%, Puts: -0.53%
→ Slight bullish bias but not overcrowded — room for gamma expansion.
🔄 Options Trade Setups Based on GEX
Bullish Gamma Squeeze Setup:
🟢 Trigger: Price breaks and holds above 161.
🧨 Target: 165 → 170 (thin GEX zone could cause sharp move).
🛡️ Strategy: Buy 160C / Sell 165C (debit spread) or long 162.5C with defined stop.
⛔ Stop: If NVDA fails to hold above 158.
Bearish Gamma Rejection Setup:
🔴 Trigger: Rejection at 160.98–162.5 zone with volume fade.
🎯 Target: 156.5 → 152.
🛡️ Strategy: Long 160P / Short 155P (bear put spread) or short 162.5C naked if IV allows.
⛔ Stop: Breakout above 162.5 invalidates this setup.
📈 1-Hour Chart Technical Analysis
Structure & Price Action:
* NVDA is in bullish market structure, forming higher lows with a clean CHoCH → BOS → retest play.
* It reclaimed the 159.20 level and is testing the 160.98–162.5 zone — a key area where momentum traders will engage.
Zones to Watch:
* Support:
→ 156.68 (minor swing support)
→ 153–152 OB zone (valid bullish OB + HVL)
* Resistance:
→ 161–162.5 (GEX resistance + supply)
→ Above 162.5 opens room to 165+
Trend & Volume:
* Strong bullish candle breaking BOS.
* Volume picked up during BOS, but follow-through needs to come with breakout candles or retest hold.
🔍 My Suggestions for Intraday/Swing Traders:
✅ Bullish Setup:
If NVDA holds above 159.20 and reclaims 161, enter on retest of 160.50.
TP1: 162.5
TP2: 165
SL: Below 157.80
❌ Bearish Setup:
If price gets rejected near 162 and breaks below 157.80 → short retracement to 153.
TP1: 156.5
TP2: 152
SL: Above 162.50
My View:
Currently bullish bias but entering a decision zone. Wait for clean breakout with volume, or short rejection if momentum fades. Keep GEX in mind — above 162.5 has little resistance and can rip.
This breakdown is for educational purposes only and not financial advice. Always manage your risk before taking a trade.

Inevitable Pull Back Coming Soon?| NVDA TSLA AAPL AMZN META MSFTStock market Forecast | QQQ SPY CME_MINI:NQ1! CME_MINI:ES1!
Mag 7 FORECAST| NASDAQ:NVDA NASDAQ:TSLA AAPL AMZN META MSFT July 2025 Forecast

NVIDIA (NVDA) 4H Setup – Rocket Booster Strategy Building🚀 NVIDIA (NVDA) 4H Setup – Rocket Booster Strategy Building Momentum After Gap-Up and Volume Spike 📈
NVIDIA (NVDA) is showing early signs of another bullish
continuation on the 4-hour chart, echoing a similar pattern seen recently on Microsoft. This setup fits well within the Rocket
Booster Strategy framework — a method focused on catching strong trend acceleration signals backed by confluence.
Here’s what’s happening on NVDA’s chart:
1. High Volume on the 4H Candle
There’s been a strong increase in volume on a bullish 4H candle, indicating significant interest at current levels. This suggests
accumulation or breakout positioning, typically a good sign ahead of momentum bursts.
2. Stochastic RSI Between 50 and 20
While the Stochastic RSI hasn’t bounced from the oversold zone yet, it’s hovering between 50 and 20 — a zone that often acts as a
launching point for continued upward momentum. This shows that buyers are gradually regaining control without being overextended.
3. Price Above the 50 EMA and 200 EMA
NVDA is currently trading well above both the 50 EMA and 200 EMA on the 4-hour chart. This bullish structure confirms a strong
underlying uptrend, and it gives added confidence to long positions.
4. Bullish Gap-Up
A gap-up occurred recently, further confirming buying pressure. Gaps during trending conditions often signal the start of a new
impulsive wave, especially when backed by rising volume and clean trend structure.
Strategy Context
This is a textbook setup for the Rocket Booster Strategy, though the Stochastic RSI is not fully reset. Instead, it’s showing a more
gradual buildup of strength — which can be an early entry signal before larger players pile in.
Entry: On 4H candle continuation or brief intraday retracement
Stop Loss: Below the gap or recent support
Target: Previous swing highs or Fibonacci-based extensions
Final Thoughts
NVIDIA is showing strong signs of bullish continuation, and this could be the early stage of a new momentum phase. The
Stochastic RSI position adds a slightly different flavor to the setup
— more of a buildup than a reversal — but the overall structure remains solid. As always, risk management is key.
Let me know in the comments if you’re watching NVDA too or already in the trade. More setups like this coming soon.
🔥 Rocket Booster Strategy: Engaged for NVDA?
Disclaimer:
This analysis is for educational and informational purposes only. It does not constitute financial advice or a recommendation to buy or sell any security.
Always do your own research and consult a licensed financial advisor before making any trading decisions. Trade at your own risk.

NVDIA to 185 or Higher base Trend ExtensionInitial Impulse Move (P1 to P2): The strong upward movement from $90.33 to $153 shows significant bullish momentum.
Healthy Retracement (P2 to P3): The pullback to $87 represents a deep correction—deeper than the starting point, suggesting a potential shakeout before resuming upward.
Extension Projection: Using the 1.618 level from this wave structure, the projected price of ~$187 serves as a potential target or resistance level where price may react or consolidate.
Technical Significance: The 1.618 level is often used by traders to anticipate where profit-taking or trend exhaustion may occur in strong moves, especially after a retracement.

NVIDIA: More Room in Wave BNvidia’s strong rally over recent weeks lifted the stock above resistance at $153.13. Despite a brief pullback on Tuesday, we still expect beige wave B to extend toward $178.39. Afterward, beige wave C should initiate a substantial correction, likely finding its low above $81.98 to complete blue wave (IV). If Nvidia rallies directly through $178.39, that would support our alternative view that blue wave alt.(IV) has already bottomed (37% probability).
📈 Over 190 precise analyses, clear entry points, and defined Target Zones - that's what we do.

NVDA Buyers Getting Squeezed? What Gamma & Price Action Say NextGEX-Based Options Insight (Gamma Exposure):
📉 NVDA is currently sitting at $152.54, just above a key PUT wall at $150, with GEX sentiment tilted bearish short-term.
* Highest Call Resistance / Gamma Wall: $160
This is the level with the strongest net positive GEX, acting as a cap where market makers may short against CALLs.
* 2nd Call Wall: $158 – Heavy positioning here, could slow price if it bounces.
* PUT Support: $150 – Strong gamma magnet; price may hover or bounce near this.
* IVR: 8.6 (low) – Options are relatively cheap.
* CALLs Flow: 2.6% bias – Weak call flow, favors downside or range behavior.
💡 Options Trade Suggestion:
Because NVDA is under the gamma wall and just above strong PUT walls, consider buying a debit PUT spread, especially if $152.50 breaks.
* Setup: Buy 155P, Sell 150P expiring this Friday
* Risk: Defined
* Reward: Targets $150 zone (gamma magnet)
* Only valid below $152.50 breakdown
1H Price Action + SMC Trade Plan (Chart 2):
🟣 Structure Breakdown Confirmed – NVDA lost its rising structure and broke BOS + CHoCH zones near $157–158.
📉 Current Bias: Bearish
Multiple break-of-structure (BOS) and change-of-character (CHoCH) events suggest a shift to downtrend.
🟩 Possible Short Entry Zone:
* Price could retest the last order block around $155–156 for a lower high before dropping.
📍 Short Trade Idea:
* Entry: Around $154.80–$155.50 (if price retests)
* Stop: Above $157.99 (previous high)
* Target: $150 (1st TP), $147.50 (2nd TP, PUT wall)
📍 Alternative Scenario (invalidates the short):
If price reclaims $158 with strength, we could get a squeeze toward the $160 gamma wall.
Conclusion & Plan:
Right now, NVDA is in a short-term downtrend, aligning with bearish GEX flow. Option sentiment, volume, and structure all favor selling bounces into $155–157 with $150 as magnet. But don’t short blindly—watch if price retests OB and rejects. Use PUT debit spreads or simple 1 DTE options with tight stops.
Disclaimer: This analysis is for educational purposes only and does not constitute financial advice. Always do your own research and manage your risk before trading.

Nvidia - More Upside After Correction NVIDIA completed an irregular flat correction back in April. Since then, the price action has been strong and steady, forming higher highs and higher swing lows —a clear sign of bullish con-
continuation.
From an Elliott Wave perspective, the current move appears incomplete, as we cannot yet identify a full five five-wave advance from the April lows. This suggests that more upside may still be ahead.
However, we could see a wave four pullback develop sometime during the summer. If that occurs, the key support zone to watch would be around $140 down to $130, which could provide
an opportunity within the ongoing uptrend.
- Resistance: 170
- Support: 143 / 132
- Invalidation: 115
GH

Nvidia Breaks Out and Stays OutNvidia has powered to new all-time highs, reclaiming its title as the world’s most valuable
company. The move is being driven by a blend of AI-fuelled optimism and technical resilience.
AI spending is alive and well
After a rocky start to the year, Nvidia’s resurgence has been fuelled by a sharp rebound in
confidence across the AI ecosystem. At the company’s shareholder meeting, CEO Jensen Huang
painted a bullish long-term picture, calling the AI boom a multitrillion-dollar opportunity and
highlighting the rise of sovereign AI infrastructure around the world. That message landed well with
the market, especially after several big tech firms reaffirmed their commitment to AI investment
during earnings season.
Micron added fuel to the rally with a blowout earnings report, topping forecasts and issuing strong
guidance on AI-driven demand. Investors have also warmed to the idea that Nvidia’s grip on the AI
hardware stack remains firm, despite rumblings of competition. Cloud giants like Microsoft and
Amazon may want to build their own chips, but for now, the fastest and most scalable path still runs
through Nvidia.
The price action tells its own story
They say the strongest stocks are the ones that bounce back quickly from bad news. Nvidia fits the
bill. After a nasty correction in Q1, triggered by China export restrictions and the DeepSeek
breakthrough, it would’ve been easy for sentiment to stay sour. Instead, since mid-April, the chart
has told a different story. The January gap has been closed, the stock has gone sideways to digest,
and now we’ve seen a clean breakout to fresh highs.
Volume was healthy on the move higher. Not euphoric, but solid enough to back the price action.
What matters now is follow-through. Traders will want to see Nvidia hold above the breakout zone,
and so far the early signs are promising. Price has now closed above the breakout for three sessions
in a row, increasing the probability that this isn’t a fake-out.
There’s also a clear ascending trendline in play, offering a reference point for future pullbacks
alongside the old horizontal resistance. The RSI is up at 76, but that’s no red flag here. Nvidia has
happily trended with the RSI in the 80s before, and momentum doesn’t tend to fizzle out just
because it’s technically overbought.
NVDA Daily Candle Chart
Past performance is not a reliable indicator of future results
Disclaimer: This is for information and learning purposes only. The information provided does not
constitute investment advice nor take into account the individual financial circumstances or
objectives of any investor. Any information that may be provided relating to past performance is not
a reliable indicator of future results or performance. Social media channels are not relevant for UK
residents.
Spread bets and CFDs are complex instruments and come with a high risk of losing money rapidly
due to leverage. 85.24% of retail investor accounts lose money when trading spread bets and
CFDs with this provider. You should consider whether you understand how spread bets and CFDs
work and whether you can afford to take the high risk of losing your money.

NVIDIA to $228If Nvidia were truly done for, why is it impossible to find their latest 5000 series GPUs?
Even if someone wanted to buy one, they simply can't.
The reason lies in Nvidia's commitment to fulfilling the soaring demand from AI data centers, which has left them unable to produce enough H100 and H200 models.
This situation also allows Nvidia to increase their profit margins significantly, capitalizing on the disparity between demand and the media frenzy surrounding them.
DeepSeek serves as a prime example of how out of touch mainstream media can be.
All DeepSeek did was replicate Chat GPT.
Training models requires substantial computing power. The panic surrounding Nvidia and other semiconductor companies is quite amusing; the demand for computing power is skyrocketing!
The gap between the reality of the AI mega-trend and the narrow focus of mainstream media is staggering! It's astonishingly out of touch! Just as out of touch as Cramer was when he declared META was done at $100, or when he thought Chat GPT would obliterate Google at $88.
Stock prices fluctuate between being overvalued and undervalued. While we have metrics like EGF and PE ratios to assess valuation, indicating that Nvidia is currently inexpensive, this doesn't guarantee it won't drop further. However, it is generally wiser to buy stocks when they are cheap rather than when they are costly.
The greater the deviation from the high then the greater the BUYING OPPORTUNITY being presented for the very best leading companies.
The key takeaway is that the deeper Nvidia falls during its corrections, the more advantageous it could be.
Those who are experiencing anxiety during these declines may find themselves selling at a loss, or for a marginal profit possibly around previous highs, while the stock has the potential to rise to $228 and beyond.
The potential for growth is significant; the $228 Fibonacci extension may not represent the peak. Attempting to predict a top for Nvidia could be misguided. Once it reaches $228, Nvidia might maintain a valuation similar to its current $130 level.

$NVDA: Levitating higher: Next Stop 175$: 250$ Before cycle endsIn this summer bull market, it makes more sense to talk about the large cap winners. NASDAQ:NVDA chart is a beauty to watch with the steady climb of this mega cap stock levitates all the indices including S&P500 and NASDAQ. After hitting 90$ during the Liberation Day drawdown the stock is 60% up since then and recovered all its losses and hitting a new ATH. With stock at 158 $ it is targeting the highs of the upward sloping Fib Retracement channel which indicates that stock can reach a price of 175$ before this run loses its steam. At RSI of 65 this is not overbought compared to its historical level of 84. Hence there might be more room left in this bull run for $NVDA. My prediction is that before end of July 2025 the stock hits 175$.
But where do we like to see this outperforming stock during this cycle of bull run. Will it hit 5T USD before Dec 2024? If NASDAQ:NVDA hits 5T USD, then the stock will be 205 $ which in my opinion not impossible before Dec 2025. 40% Upside in the Market Cap and the stock price is achievable in a momentum stock like $NVDA.
Verdict: NASDAQ:NVDA @ 175 $ before July 2025 & 205 $ or 5 T USD Market Cap before Dec 2025

$NVDA Tradespoon – Long Entry $152.62Tradespoon model generated long signal for NASDAQ:NVDA . Predicted range: $152.62–$158.22. Trend: -0.22%. NASDAQ:NVDA

Nvidia Key Resistance Test—Will $157.75 Trigger Rally? Current Price: $157.75
Direction: LONG
Targets:
- T1 = $161.80
- T2 = $169.50
Stop Levels:
- S1 = $155.25
- S2 = $150.75
**Wisdom of Professional Traders:**
This analysis synthesizes insights from thousands of professional traders and market experts, leveraging collective intelligence to identify high-probability trade setups. The wisdom of crowds principle suggests that aggregated market perspectives from experienced professionals often outperform individual forecasts, reducing cognitive biases and highlighting consensus opportunities in Nvidia.
**Key Insights:**
Nvidia remains a market leader in technology, benefiting from its dominance in artificial intelligence processing units and a growing demand for critical computing infrastructure. Traders widely recognize Nvidia's ability to capitalize on high-margin opportunities in the AI space and data-center expansion. Recently, bullish momentum patterns supported a breakout forecast, with expert price models suggesting that Nvidia will likely attempt key resistance zones before pushing higher.
However, challenges such as supply-chain constraints for semiconductor chips and broader sector overbought conditions might lead to intermittent retracements. Nvidia's historical resilience in tight cycles offers optimism, with analysts signaling growth opportunities as new catalysts emerge from both technical and fundamental perspectives.
**Recent Performance:**
Nvidia's stock performance has demonstrated volatility but remains strong year-to-date, driven by widespread adoption of AI technologies and strategic investments in autonomous systems, gaming advancements, and supercomputing infrastructure. Price action displays resilience near support levels and hints at a continuation of bullish trends. The stock recently formed a golden cross—a bullish technical indicator where the 50-day moving average crosses above the 200-day moving average—highlighting potential upside targets.
**Expert Analysis:**
Market professionals remain optimistic, projecting favorable long-term growth across Nvidia's highly profitable product lines. AI is expected to fuel enterprise solutions growth, with supercomputing initiatives providing durable momentum opportunities. Analysts also point out Nvidia's active partnerships with world-leading enterprises, including in sectors like autonomous vehicles, gaming, and cloud computing. Despite optimistic forecasts, traders should monitor overbought conditions and sector-wide supply bottlenecks before aggressively scaling positions. Resistance levels near $160 could spark consolidation, offering better entry points for subsequent moves higher.
**News Impact:**
Recent developments reinforce Nvidia's strategic positioning, including massive investments in AI-driven innovations and global partnerships. New product announcements and collaborative ventures with big tech players have amplified Nvidia's stock sentiment in expert circles. Yet, industry-wide chip shortages and macroeconomic concerns persist, potentially hampering rapid price acceleration. Positive earnings surprises or key news events in the coming quarter may further support a bullish case for Nvidia, validating its resilience as a top-tier growth stock.
**Trading Recommendation:**
Given Nvidia's sustained strength, coupled with bullish technical formations, a long position appears justified for traders seeking upside exposure. Current price action suggests well-supported price continuity amid investor enthusiasm for AI and supercomputing growth. Primary resistance levels at $161 and second-tier targets near $169 offer traders strong profit-taking junctures. Stop-loss levels below $155 safeguard against potential sector-wide retracements, ensuring disciplined risk management to preserve capital while leveraging Nvidia’s growth trajectory.

The King Roars AgainRS Rating of 95
Breaking out of key pivotal zone
Wall of Buyers displaying institution appetite
RTX 5000 Series debuted at a very friendly consumer price
Looking forward shows no signs of decelerating growth prospects for the Wall Street darling
I have reasons to believe this security price can increase in value

NVDA at Inflection Point: Reclaim $158 or Fade to $150?NVDA at Inflection Point: Reclaim $158 or Fade to $150? Monday Setup Ready 📉📈
🧠 GEX-Based Options Sentiment:
— The $158.71 level is the highest positive GEX zone and aligns with the 2nd CALL Wall. This is the strongest gamma resistance — the level to beat.
— $157.50 is the 3rd CALL Wall (7.99% GEX) and has acted as a ceiling — NVDA is currently pinned underneath.
— Below, $152.50 to $150 forms a GEX magnet zone, where price is likely to gravitate if weakness sets in.
— The $149 HVL zone also aligns with this gamma pocket, making it a strong downside target.
— Implied Volatility Rank (IVR) is very low at 6.8, which makes options cheap — ideal for buying directional calls or puts.
— Call flow shows a moderate bullish lean (5.4%), but nothing extreme. No signs of a major squeeze — yet.
🔧 Options Setup for Monday–Wednesday:
Bullish Trade Idea:
If NVDA breaks and holds above $158, consider buying a CALL debit spread, such as 158c/165c expiring July 3 or July 5.
Target zones would be $160 and $165 based on GEX7 and GEX6.
Stop-loss would be a move back under $157, especially on rising volume.
Bearish Trade Idea:
If NVDA fails to reclaim $157 and breaks below $155, consider a PUT or a PUT debit spread. 155p to 150p (Jul 3 expiry) would be the play.
First target is $152.50, followed by $149.
Stop if price recovers $157.50 with strong bid.
📉 Intraday Technical Breakdown (1H Chart):
The structure shows clear signs of weakening strength.
— NVDA had a confirmed BOS, but now it’s printing a CHoCH just under the trendline and inside a supply zone.
— Price rejected multiple times near $158.
— Volume spiked into the Friday close but did not confirm breakout — more likely to be profit-taking or gamma hedging.
— The short-term trendline has been broken, and bulls are defending the structure weakly.
📌 Key Intraday Levels to Watch:
— $158.71: Gamma ceiling and major supply zone. Break above this can lead to a squeeze.
— $157.00: Local resistance from Friday.
— $155.02: BOS level and key decision point.
— $152.50–150.00: Gamma magnet and thin volume shelf — likely destination if price breaks.
— $149.00: HVL zone and major demand.
✅ Thoughts and Game Plan:
NVDA looks vulnerable to a fade if bulls fail to reclaim $158 early in the session. It has rallied sharply the past week and is now stalling beneath gamma resistance. The CHoCH under trendline shows supply defending. If Monday opens flat or slightly weak and price stays under $157.50, I expect bears to press it toward $152.50 quickly, maybe even $149 by midweek.
But if buyers step up and push a reclaim above $158.71, the next gamma wall is at $160–$165 — that’s where a breakout can accelerate. In that case, the IV being cheap favors buying calls.
Be patient and don’t front-run Monday open. Let price confirm. The best edge here comes from reacting to the key levels — not guessing them.
Disclaimer:
This analysis is for educational purposes only and is not financial advice. Always do your own research, trade your plan, and manage risk accordingly.
