Change of fortune for House BuildersThe decline in house building stocks appears to be nearing its end.
The end of the hiking cycle should improve sentiment for householders.
The price is approaching the lower end of the trend channel and represents an attractive risk/reward opportunity.
OHP trade ideas

More upside coming soon? 📈See chart image. Entered long here. A little bit too late but it seems like it works so far. If you've got questions feel free to use the comment section here. Good trades, folks!

PSN bounced off supportPSN bounced off support after descending rapidly
No advice given
research needed but the chart looks good

PSN I do not provide personal investment advice and I am not a qualified licensed investment advisor.

$PSNBig UK constructor.. I think the last swing high is in 3 rather than a 5 as labelled but we have 5 waves down from highs in A and trendline a logical place to reshort. You can see it held prior 4 ...unlike a lot of stocks it could not take out pre Covid highs in spite of speculative buying frenzy post Covid

PSN buy with 4 reward:risk ratioPersimmon has been following a trend channel and bounced off the bottom a couple of days back, supported by the 200 DMA.
A Buy indicator today with a fairly tight stop below the 20 and 50 MAs for support gives this a decent R:R if we target the top of the channel for take profit and coincidentally the pre-covid highs.

Persimmon could see -5% pull backGaps normally get filled pretty quickly on the 1 day Persimmon chart, and with RSI levels being quite high a pull back is likely in my opinion.


Persimmon - Looks set to re-build its share price.Technicals
Persimmon is holding at key support and showing signs of attracting value hunters. I also note the bullish divergence on the relative ratio (Persimmon share price / UKX). The price of sterling has been a drag on the shares and with GBP moving higher yesterday it could offer some relief to domestic stocks. Technically and fundamentally, Persimmon looks good value here.
Fundamentals
Persimmon currently ranks towards the top of our fundamental model with exceptional scores on value, profitability, momentum and quality metrics. The shares have underperformed the market over the past 1 to 3 months but we do not expect this to continue.
Pros
Ranks in the top 5 of our fundamental ranking model.
Canaccord Genuity reiterated ‘Buy’ advice on the 20th August with a price target of 2720p.
The business continues to produce steady cash flow and boasts a healthy dividend.
Cons
Sales have slowed in recent months.
Peel Hunt reiterated its hold rating on the 1st May 2019 with a price target of 2025p.
Complaints have been raised about the quality of Persimmon homes, this may act as a drag in the short term.
Stop: 1790p
Target: 2430p

Attempt to catch the short-term trend reversal/correctionAfter the strong up move that lasted for quite a while without any significant pullbacks, the shooting star pattern appeared in the "grey area" of assumed resistance.
1)Going short with my Stop loss over the high of the shooting star.
2)The profit target is based on the assumed 50% correction and technical structure.

Weekly more bullish case.Maybe still in a Wave 3 with Wave 4 & 5 to come. Could still make a new high this year but predicting a big drop after (-40% plus)


PSN edging closer to a major top.PSN should be looking for a large correction after Wave 5 competes. Maybe at the end of this year or early next.

Persimmon Imminent Bullish Reversal After bouncing off its channel support with a rounded bottom, we are looking at the beginning of a bullish reversal. Within the oversold stochastic, there has just been a bullish crossover. The MACD is beginning to converge. Furthermore, it's still trading above the ichimoku cloud, which also acts as a support. To top it all off, the technicals lined up here have already triggered all previous bullish reversals within this channel. It would probably be wise to go long.

Persimmon - Bullish breakBullish from the downward channel marks the continuation of the rally from the Brexit day low. On the higher side, major resistance is seen around 1900-1910 levels (falling trend line resistance).
On the downside, only a daily close below 1800 would signal bullish invalidation.

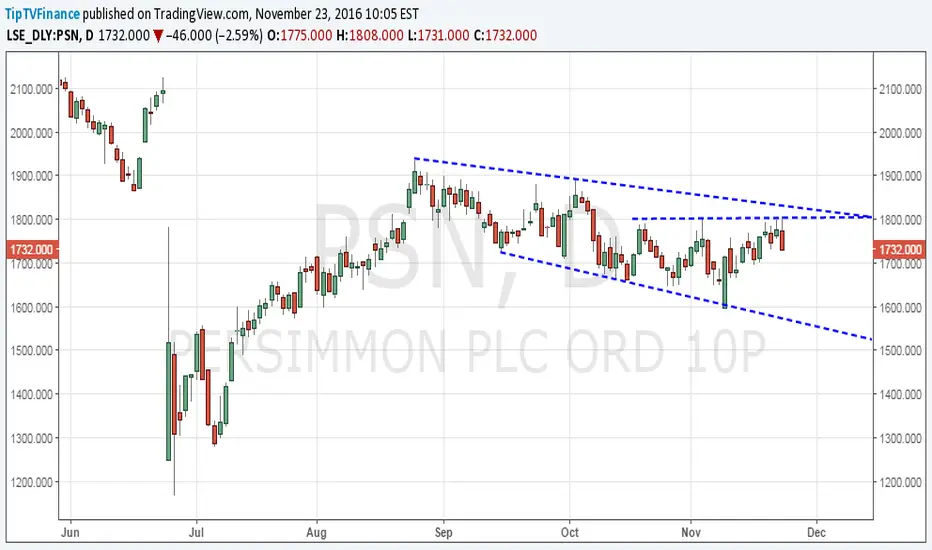
Persimmon – Bearish outside day candle at critical resistanceThe stock retreated from the critical resistance around the psychological figure of 1800 and was last seen trading around 1732.
The daily candle is now a bearish outside day.
A break below 1700 would open doors for a test of the falling channel floor seen today around 1573.
Persimmon (PSN LN) ahead of earnings (2nd Nov)Tomorrow brings the earnings of UK home builder Persimmon.
UK home builders have performed well in recent times with the UK government backing the housing market with expansion plans. In terms of recent broker recommendations UBS, Credit Suisse and Canaccord have all upgraded to company within the last 4 months.
* The weekly chart is showing bullish hammer candles.
* On the hourly chart we are at a relatively low level.
* On the Daily chart we support at the upward trendline.
* Could see resistance at the downward trendline on the linked chart.
* In regards to Volume the VPOC (Oct) is at around the 1726.13 area, do not be surprised if this is a support level.
* Oct high of 1892.65, Low of 1648.88 and highest amount of contracts exchanged (Value) 1725.30
R4 1648.88
R3 1831.04
R2 1787.93
R1 1735.39
Current 1731.00
S1 1720.63
S2 1648.88

Persimmon – Attempting a bullish breakDaily chart pattern – Rising channel
Housebuilder Persimmon has reported a 29% jump in first-half profits and said customer interest since the Brexit vote has been "robust". At the time of writing, shares were up 3.68% at 1860 levels. Daily high stands at 1884 levels.
A bullish break above 200-DMA level of 1901 would open doors for pre-Brexit level of 2125. The daily RSI and money flow index remain supportive of such a move.
On the lower side, only day end close below 50-DMA (seen today at 1657) would signal the corrective rally from the post Brexit lows has ended.

Flat on Persimmon PLCI think the UK housing market is still facing some uncertainty due to the Brexit referendum and so I still remain flat on the stock until article 50 is invoked. I do think short term the gap has to be filled on cable so would look for short term buys for technical value.

Persimmon - inverse flg and pole, RSI signaling weaknessHourly chart has -
Inverse flag and pole formation. This a continuation pattern which means a bearish break signals continuation the downtrend.
The hourly RSI has formed falling tops, which suggests the odds of prices moving towards a bearish break are high.
