KEEP TRADING SIMPLE - BYONGood Morning,
Here we have BYON. Currently we can see a distinct double bottom. This is signalling a change in trend. We have some divergence associate in the volume with BYON which would also signal the same.
Because the indexes will be trending in a bullish manor the next few days, I would buy and hold short term and assess at my exit point to see how healthy the market is.
Thanks
OVER trade ideas

A meme stock, at value prices?It’s not often that you see a meme tier stock trading at deep enough value to attract the attention of highly successful long term investors. This is a classic euthanasia coaster stock from well before Covid, with massive pump & dump patterns all the way back to 2002 that continue to echo in the price chart and are absolutely going to continue appearing. The company made its meme status official by acquiring the intellectual property assets of Bed Bath & Beyond in mid 2023.
When a meme stock becomes a value stock, it’s time to bid.
If the company can start to turn around its failing business, which is very possible in this cyclical furniture industry, this will ignite a retail trader mania that will create massive momentum and continue rising at faster and faster speeds. The long term target for Byon is $30. This trade could take a few years to play out but I think it's a great idea if you can be patient. I don't have too much of a position yet, and I will only be buying more if the price can start going up fast and confirming that I'm correct.

BYON/USD – 30-Min Long Trade Setup!📉 🚀
🔹 Asset: BYON (Beyond, Inc.)
🔹 Timeframe: 30-Min Chart
🔹 Setup Type: Bullish Wedge Breakout
📌 Trade Plan (Long Position)
✅ Entry Zone: Above $6.50 (Breakout Confirmation)
✅ Stop-Loss (SL): Below $5.97 (Break of Support)
🎯 Take Profit Targets:
📌 TP1: $6.90 (First Resistance Level)
📌 TP2: $7.46 (Final Target – Extended Move)
📊 Risk-Reward Ratio Calculation
📈 Risk (SL Distance): $6.50 - $5.97 = $0.53 per share
📈 Reward to TP1: $6.90 - $6.50 = $0.40 (1:0.75 R/R)
📈 Reward to TP2: $7.46 - $6.50 = $0.96 (1:1.8 R/R)
🔍 Technical Analysis & Strategy
📌 Falling Wedge Pattern: A breakout above $6.50 signals bullish reversal.
📌 Volume Confirmation Needed: Strong buying above $6.50 confirms trend shift.
📌 Momentum Shift Expected: Sustained move above $6.50 could push to $6.90 (TP1) and $7.46 (TP2).
📊 Key Support & Resistance Levels
🟢 $5.97 – Key Support / Stop-Loss Level
🟡 $6.50 – Entry / Breakout Level
🔴 $6.90 – First Target / TP1
🔴 $7.46 – Final Target / TP2
📉 Trade Execution & Risk Management
📊 Volume Confirmation: Ensure strong buying above $6.50 before entry.
📈 Trailing Stop Strategy: Move SL to entry ($6.50) after TP1 ($6.90) is hit.
💰 Partial Profit Booking Strategy:
✔ Take 50% profits at TP1 ($6.90), let the rest run to TP2 ($7.46).
✔ Adjust Stop-Loss to Break-even ($6.50) after TP1 is reached.
⚠️ Breakout Failure Risk
❌ If price rejects $6.50 and falls below $5.97, exit early to avoid fakeout.
❌ Wait for a strong bullish candle close above $6.50 before entering.
🚀 Final Thoughts
✔ Bullish Setup – Breakout above $6.50 confirms momentum.
✔ Momentum Shift Possible – Watch for volume confirmation.
✔ Favorable Risk-Reward Ratio – 1:0.75 (TP1) & 1:1.8 (TP2).
💡 Stick to the plan, manage risk, and trade smart! 🚀🏆
🔗 #StockTrading #BYON #BreakoutTrade #TechnicalAnalysis #MomentumStocks #ProfittoPath #TradingView #StockMarket #SwingTrading #RiskManagement #ChartAnalysis 📈🚀

Long Byon For Sure!!Long term support we broke the down trend. Coming back for a retest now. Big returns possible on this long term trade. Good luck and hopefully it works out

Trade Review - BYONWhen SAGE showed up in screener there was a bullish continuation pattern on the daily timeframe and a potential exhaustion on the higher timeframe.
The higher timeframe is in a downtrend, have made a measured move down (volatility projection) and is extended from the mean, thus we observe for potential reversion.
The lower timeframe provided a bullish continuation setup, which allows us to enter with a more structured approach. The target was a measured move up, as this is a projection of the current volatility.

BYON Long Trade Setup (30-Min Chart)!### **🚀) 📈🔥**
🔍 **Stock:** BYON (NYSE)
⏳ **Timeframe:** 30-Min Chart
📈 **Setup Type:** Bullish Continuation
---
### **📍 Trade Plan:**
✅ **Entry:** **$8.12** (Breakout Retest Confirmation)
❌ **Stop-Loss (SL):** **$7.54** (Below key support for risk management)
🎯 **Target 1:** **$8.55** (First Resistance Level)
🚀 **Target 2:** **$9.30** (Major Resistance Level – Moon Shot! 🌙)
🔹 **Risk-Reward Ratio:** Favorable setup 📊
🔹 **Momentum:** Strong **trend continuation with breakout pullback** 📈
🔹 **Pattern:** **Ascending triangle breakout retest**
---
### **🔥 Trade Strategy & Refinements:**
📊 **Volume Confirmation:** Ensure strong buying volume supports the breakout.
📉 **Trailing Stop Strategy:** If price reaches **$8.55**, consider moving SL to breakeven ($8.12) or higher.
💰 **Partial Profit Booking:** Take some profits at **Target 1** and let the rest ride towards **Target 2**.
⚠️ **Watch for Retest:** If price retests **$8.12** and holds, it confirms continued momentum.
---
### **🚀 Final Thoughts:**
✅ **Bullish Chart Setup** – Retest of breakout confirms potential upside.
✅ **Support Holding Well** – Key level at **$8.12** acting as a base.
✅ **Risk Management in Place** – SL ensures controlled downside.
**Plan Your Trade & Trade Your Plan!** 🏆💰
Let me know if you need any modifications! 🚀📈
#BreakoutTrading #StockMarket #TradingStrategy #TechnicalAnalysis #DayTrading #SwingTrading #MomentumTrading #ChartPatterns #PriceAction #BullishBreakout #TradeSetup #StocksToWatch #StockCharts #TradingView #StockSignals #TradingPlan #MarketAnalysis #RiskReward #SupportAndResistance #ProfitToPath #TradeSmart #WealthBuilding #TradingSuccess #MoneyMoves

Beyond | BYND | Long at $6.00Beyond NYSE:BYON .
The bad:
Highly speculative play.
Currently unprofitable and not forecast to become profitable over the next 3 years.
Has less than 1 year of cash runway.
The good:
Insider buying below $10 (especially in the $6-$7 range) is outweighing insider selling. The last dip below $7 saw the Officer and Director grab over $1.5 million worth of shares.
Chart setup is nice, although a move to the high $4 area is not out of the question. The gap above the current price is a great target area as the price seems to be consolidating.
Float=45M, short interest=17%. Could get squeezed, or ...
The company's blockchain assets, tZERO and Medici, are significantly more valuable than the retail ops based on current market values.
Recent layoffs may help with future profitability.
Acquisition candidate.
Santa rally?
At $6.00, NYSE:BYON is in a personal buy zone as a purely speculative play.
Target #1: $7.50
Target #2: $8.50
Target #3: $9.30

$BYONGreen: Entry Point
Blue: Start of Week
Red: End of Week
Thumbs Up: Trade Available for Week
Numbers: Price Targets
*For share traders only. Not meant for options.

To infinity & BYON - $375-$660
BYON is replicating the same fractal from 2012-2018 but on a grander scale
It has reached the end of its downtrend (B) and will soon resume Wave C - of equal length to A.
In the short-term BYON is about to cross above a steep downtrend line (yellow), just like it did in May 2012 and April 2020.
RSI is incredibly oversold on all timeframes (38 on 3D, 32 on W) but will soon exit the RSI bear zone (in red).
Target of $375 (38x from current levels of $10.11) coincides with the 1.272 fibonacci level
Extended target of $660 (66x from current levels) translates to 1.414 fib.
Time target is flexible but around June 2026 will likely be a great time to exit, if targets are met.
Last time out in Feb 2018, BYON hit 1.414 fib in Wave C.
Simple stop-loss of $8,a break-down from current levels.
BYON by name, Beyond by nature!
Thanks for reading.
P.S. If you like the RSI Bull/Bear Thresholds indicator at the bottom of the screen, drop a comment below. It will soon be made available for a small audience of users for a reasonable fee.

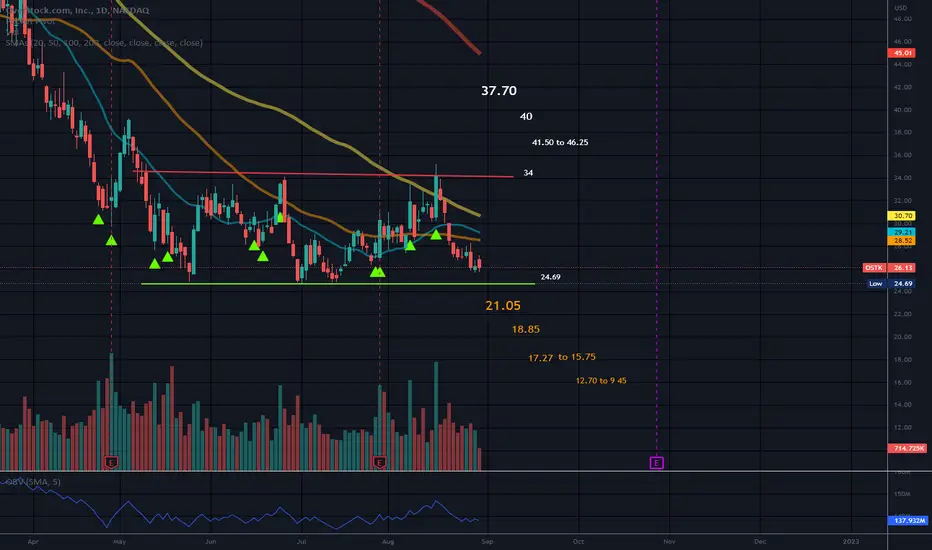
BEYOND INC POISED FOR A SURGE ON THE BACK OF POSITIVE EARNINGSSince October 2023, NYSE:BYON has consistently traded within an ascending trendline indicating a bullish pattern where the stock consistently experienced higher lows reflecting investor confidence and positive market sentiment.
Following the last earnings report, Beyond INC witnessed a remarkable surge of 74%, reaching a peak of $37. However, the stock has since retraced by 46%. While this may seem like a significant pullback, it could also present a potential buying opportunity for traders looking to enter the market at a lower price point.
The candlesticks are currently trading below the Simple Moving Averages (SMA) of 40 and 250. This technical setup often indicates a buying opportunity for traders, especially if the stock trades near the hypothetical support level.
The Relative Strength Index (RSI) shows initial signs of reversal, suggesting the stock may be oversold and poised for a bounce back.
There has been strong buying pressure over the past two days, as indicated by the green Heikin-Ashi candlestick. The absence of a lower wick on the candlestick reflects strength in the current price action, as buyers are in control and there's minimal selling pressure at these levels.
These bullish signals further support the potential for a price reversal.
The upcoming earnings report on Monday will be a crucial factor in confirming the fundamental metrics of Beyond INC. Positive earnings results could act as a catalyst for further price appreciation, while disappointing earnings could lead to further downside pressure on the stock.

Nice setup for $BYON, $50 Party soonNice NYSE:BYON chart setup, with the next earnings report in 11 days. If the outcome is positive, the stock will reach a peak of $50 in the next 40 days or so.

Ascending Triangle breakout for BYON...It appears as though BYON is trading in an ascending triangle.
On the KST there has been a bullish cross.
The stock is finding support at the DMI, and has broken above the 200 DMA for the second time in two years since the downtrend from ATHs.

BYON Beyond Inverse Head and Shoulders Pattern.Beyond seems to be printing an Inverse Head and Shoulders pattern, and this is Bullish.
I've switched to a simple Line Chart to depict this.
The recent market trends could prove this Wrong.
Time will tell.
Enjoy. Regards Graham.

BYON Study using the Trend Cloud System.Beyond ,,, Not the Meat Company.
This Ticker popped up, so I did a study and dropped some after seeing a few clues as seen on my Study.
The Chart shows all.
TIP: Use the Call Outs as seen to Diarise your Investment choices ETC.
Use your many Indicators available to make decisions.
Also please use an Experts Advice.
While I might be +-75% correct, I also get the rest Wrong!
However, by studying the Trend, you can get better.
Smash that "Rocket Boost Button" to show your appreciation for my Study!
Kind Regards Graham.

$OSTK ~ Correction Completing...Overstock.com, Inc. operates an online shopping site. It also sells these products through www.overstock.com, www.o.com, and www.o.biz. It operates through the following business segments: Retail, tZERO, and MVI. The Retail Segment engages in e-commerce sales through its website. The tZERO Segment focuses on securities transaction through its broker-dealers. The MVI segment consists of the Medici business. The company was founded on May 5, 1997 and is headquartered in Midvale, UT.

$OSTK: Will we lose 20 too?NASDAQ:OSTK is showing some weakeness here today along with the rest of retail (XRT) and small caps (IWM). Looking to see if this stocks a little bit more before things get better. We'll be following for developments. Good luck traders!

OSTK is really testing my patience50x in 5 months and over three years this crumbling - but it'll be over hopefully soon :) Expecting more weakness into the end of the year but then hoping for the next 50x up... bag holders (like me) deserve it eventually ;)

$OSTK - UPTRENDCouldn't find much coverage so I initiated one.
Looking at the chart, I believe NASDAQ:OSTK is starting a run up after upbeat Q2 earnings along with acquisition if NASDAQ:BBBY IP assets and the future outlook is better as stated by management. Still there is work needs to be done. NASDAQ:OSTK received a couple of upgrades after ER.
On the technical side, i think it needs to be above $35 to consolidate for some time and shouldn't close below $33.5 on the daily and that will my stop loss. I drew the fibs from the highs of Sept 22 and drew a cup and handle (ugly btw). If you have no position I recommend you scale in at $35 and below or wait until it closes above its 200 EMA @ $37/$38.
Currently am holding Sept $40 Calls bought on yesterday's retracement.
Appreciate your thoughts/Will update as we move forward.
Stay tuned.

A 9x "return" in one day for $OSTK!?!NASDAQ:OSTK paid $21.5M for the Bed Bath & Beyond brand (in bankruptcy) and gained around $228M in market cap in just one day. That's one amazing return on investment!
With hindsight, I can see how the confirmation of the 200DMA breakout was a buy signal ahead of today's surge. Now, OSTK trades far too high above its upper Bollinger Band (BB) to chase. Instead, it is buy the dip time on OSTK but downside risks could still be large. I would minimize the downside risks by looking to buy a "calm after the storm" setup. Per swingtradebot, a calm after the storm...
"...finds stocks which have recently had a significant range expansion and are now experiencing range contraction. A trader can use the contraction to anticipate a return to an expansion phase. One idea would be to enter a trade as price exceeds the range of the contraction bar with a stop-loss at the other extreme of the contraction bar."

OSTK = BBBYA U.S. bankruptcy judge on Tuesday approved Overstock.com's $21.5 million purchase of Bed Bath & Beyond's brand name, intellectual property and ecommerce platform. Overstock emerged as the winning bidder for the company's intellectual property in a deal worth $21.5 million, court filings showed on Thursday. Bed Bath & Beyond stores and inventory are not part of the deal. (Source: Reuters June 27th)
I will be watching how this unfolds before I can make a short or long thesis. That's why I am posting a blank weekly chart of OSTK until I see something that makes sense. My hunch is that BBBY traders might take a hold of OSTK stock upside momentum short term, followed by a short seller drop afterwards. We'll see, I'm neutral for now.

RectangleOSTK is in a horizontal trading channel and appears to be closing in on the bottom trendline.
Neutral pattern until a trendline is broken.
No recommendation.
Short interest is around 3.63%.
$OSTK Overstock Bullish GartleyReal nice weekly Gartley here with Bullish divergence above historically critical zones.

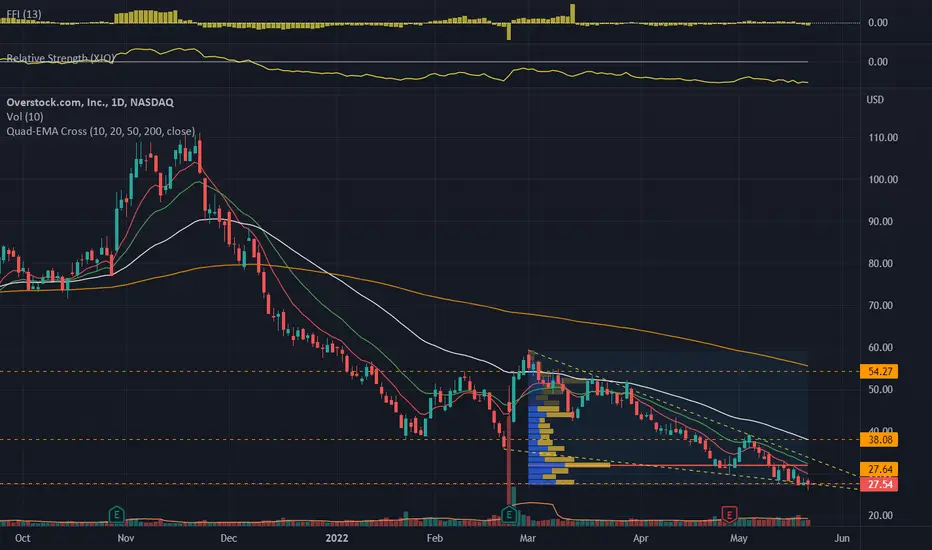
OSTK.NAS_Bearish Breakdown Trade_ShortENTRY: 26.46
SL: 31.74
TP1: 24.69
TP2: 20.71
- ADX>25
- Daily RS -ve
- Daily FFI -ve
- Weekly RS -ve
- Weekly FFI +ve
- Moving averages are aligned.
- Entry based on 18 May 2022 breakdown from range to ATL and >3% rebound off 10EMA.