100-150 could be the short term target for plug power While PLUG has had one of the best performance of the last year it could doubled in the next several weeks!
PLUN trade ideas

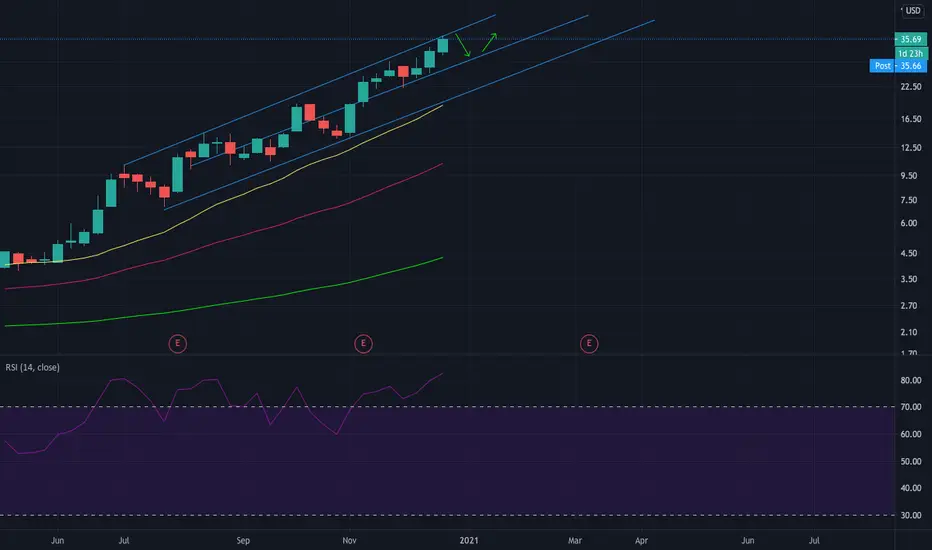
Plug went parabolic without meWhere this goes is TBD.
I saw the news on plug and threw down a few shares on black. Turned my attention elsewhere. I guess a bunch of other folks saw the same news and the stock has gone parabolic. I would not FOMO at this point unless there is some specificity around the speculation.
Any content here should not be relied upon as advice or construed as providing recommendations of any kind. It is your responsibility to confirm and decide which trades to make. Trade only with risk capital; that is, trade with money that, if lost, will not adversely impact your lifestyle and your ability to meet your financial obligations. Past results are no indication of future performance. In no event should the content of this correspondence be construed as an express or implied promise or guarantee.

analysis on the smaller timeframe, PLUGreclaimed its uptrend after a short trap at the open, we need this momentum continues/trend to remain bullish... that + 54/55.98 resistance breaking and plug has potential to cross 60-70+ this week!

congrats to those who got in!plug is the definition of a parabolic breakout with no signs of slowing down, ive seen stocks go 2-100 in 3 days, dont be surprised if plug crosses 100 and makes a run for 200 one of these days. goodluck to longs here. and congrats to the diamond hands !

My ideas on PLUG for what its worth if a pullback begins MondayJust joined the TradingView group and so far I'm in heaven, you all are awesome.
With that gain we had this week, I find it hard to not witness a healthy pullback beginning early Monday.
I'll be watching for a quick scalp off the 23.6% and then a much larger entry at the 38.6% (with options)
What are your thoughts coming into the next couple days in PLUG?
Goodluck out there!

Plug Power Stock AnalysisTechnical Analysis: The idea is to go long, following the major Trend
Possible Support Level 47.5 USD and 50usd
Fundamental Analysis: The Idea is to go long
Plug Power announced on Thursday a partnership with the Korean-based SK Group.
Marsh said Plug Power's mission continues to be expanding the green hydrogen economy and their partnership with SK in Korea is another step forward in that mission. He said the conglomerate chose to work with Plug Power because they could "do it all," from building hydrogen fuel stations, to generating green hydrogen and even backup power facilities.
NASDAQ:PLUG

PLUG: Key Points to keep in mind!Hello traders and investors! Let’s analyze PLUG today! I never did a public analysis about it, so, it’ll be my first time here.
First, we have a quite strong bull trend in the hourly chart, and we have some key points to keep in mind. The black line is an interesting point, as it was a resistance in the past, and a pivot point , so it is a good support candidate if PLUG corrects. Also, we have the 21 ema pointing up, which is another good sign.
We have a classic Breakaway Gap , which was the trigger of this movement. This tells me that the bull trend will persist a little longer, but we can’t discard that it’ll do pullbacks in the future. If you are afraid of a pullback, just look the daily chart:
Ok, so we can see the $ 46.95 from here too, but if PLUG loses this point and drops more, we’ll have a strong support area near the purple line region and the 21 ema. If PLUG hit there, I think this would be just an opportunity to buy (or buy more).
I know we may have an Evening Doji Star candlestick pattern if it closes this way, but again, if triggered, this would be a pullback sign, not a reversal sign.
Another thing to keep in mind is the high volume during this bullish leg, which is another good sign. This bull trend is real, so, pullbacks shouldn’t scare anyone around. If this movement had low volume, then it would be just speculation.
Remember to support this analysis if it helped you and follow me to keep in touch with my daily studies.
Thank you very much.


Plug Power | Plug PartyPlug Power's post-market trading, and now pre-market trading is looking excellent: 20%+ ups or higher. Yesterday, Plug Power announced a strategic partnership with the South Korean SK Group to accelerate H2 expansion in Asian Markets. This is about a $1.5 billion strategic investment!

Plug rally.. Channel and FibDaily channel on plug.. Double bottom break out today (Redline) . Went up huge in the aftermarket which would put it outside it's on a breakout.. RSI ain't the best MFI is decent.. Fibonacci targets are greenlines.
PLUG, MACD Histogram just turned negativeThis is a Bearish indicator signaling PLUG's price could decline from here. Traders may explore shorting the stock or put options. Tickeron's A.I. dvisor identified 43 similar cases where PLUG's MACD histogram became negative, and 36 of them led to successful outcomes. Odds of Success: 84%. Current price $32.40 is above $23.85 the highest resistance line found by Tickeron A.I. Throughout the month of 12/01/20 - 01/04/21, the price experienced a +31% Uptrend, while the week of 12/24/20 - 01/04/21 shows a -10% Downtrend.
Bearish Trend Analysis
The 10-day RSI Indicator for PLUG moved out of overbought territory on December 28, 2020. This could be a bearish sign for the stock. Traders may want to consider selling the stock or buying put options. Tickeron's A.I.dvisor looked at 35 similar instances where the indicator moved out of overbought territory. In 30 of the 35 cases, the stock moved lower in the following days. This puts the odds of a move lower at 86%.
The Stochastic Indicator may be shifting from an upward trend to a downward trend. Tickeron A.I. detected that in 40 of 52 cases where PLUG's Stochastic Oscillator exited the overbought zone, the price fell further within the following month. The odds of a continued downward trend are 77%.
The Moving Average Convergence Divergence Histogram (MACD) for PLUG turned negative on January 04, 2021. This could be a sign that the stock is set to turn lower in the coming weeks. Traders may want to sell the stock or buy put options. Tickeron's A.I.dvisor looked at 43 similar instances when the indicator turned negative. In 36 of the 43 cases the stock turned lower in the days that followed. This puts the odds of success at 84%.
Following a 3-day decline, the stock is projected to fall further. Considering past instances where PLUG declined for three days, the price rose further in 50 of 62 cases within the following month. The odds of a continued downward trend are 78%.


Plug Power $PLUG - investment idea 💡 Beautiful discount 👌
This idea is based on my technical analysis only.
Do your research and trade on your own risk!


Ageless Stock: Green Energy is the new future of worldBiden said that 'we will invest green energy'.
green energy is the new future of the world. inevitable.
so in next years, similar stocks will explode upward.
important note: It is not investment advice.

goodbye PLUGFib retracements see PLUG going back down to 30. Especially with market sentiment and the hammer doji at the top. Hammer down possibly


looking for a small dipi sold my shares way too early smh. looking for a dip buy around 29-30, id put mental sl and 26-27 and target 35 after entering. goodluck to longs here :) pt 100 in 2021?
Profit_Taking_4_PLUGPLUG and FCEL making waves but the ebb and flow of the market needs to look at Fundamentals and pick winners and losers...STILL, an impressive YTD return for both stocks in the fuel cell sector and may need to correlate with other stocks in the sector.

$PLUG Harmonic pattern with all the hype to EV car sector $PLUG looks like it's run on repeatable harmonic patterns along with 50MA
