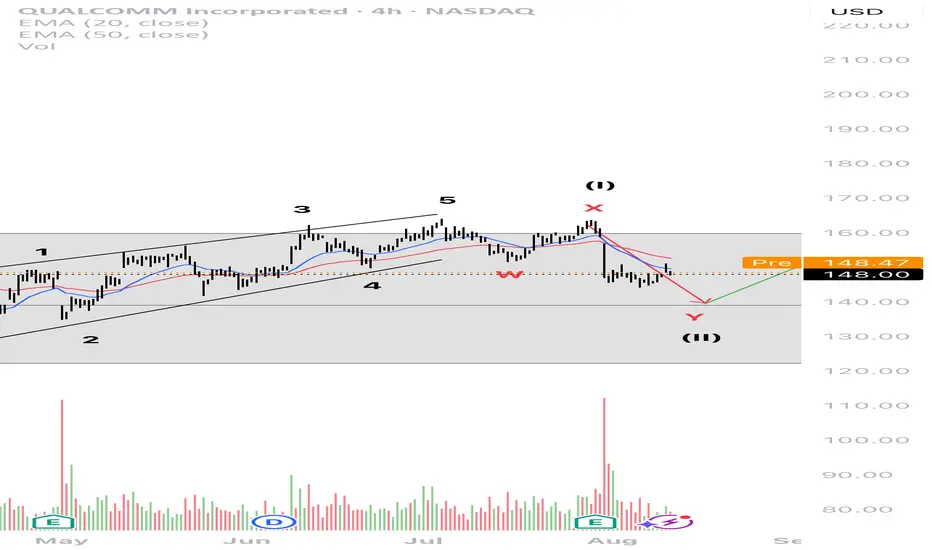
QCOM 4H#QCOM 4H
- I expect another shorter and milder Wave 2 correction in the form of a WXY, after which I anticipate a larger Wave 3 with a possible extension. I will provide an update on Wave 3 once the bottom of Wave 2 is formed. Stay tuned.
QCI trade ideas
Qualcomm: Beyond the Smartphone Storm?Qualcomm (NASDAQ:QCOM) navigates a dynamic landscape, demonstrating resilience despite smartphone market headwinds and geopolitical complexities. Bernstein SocGen Group recently reaffirmed its "Outperform" rating, setting a \$185.00 price target. This confidence stems from Qualcomm's robust financials, including a 16% revenue growth over the last year and strong liquidity. While concerns persist regarding potential Section 232 tariffs and Apple's diminishing contribution, the company's strategic diversification into high-growth "adjacency" markets like automotive and IoT promises significant value. Qualcomm currently trades at a substantial discount compared to the S&P 500 and the Philadelphia Semiconductor Index (SOX), signaling an attractive entry point for discerning investors.
Qualcomm's technological prowess underpins its long-term growth narrative, extending far beyond its core wireless chipmaking. The company aggressively pushes **on-device AI**, leveraging its Qualcomm AI Engine to enable power-efficient, private, and low-latency AI applications across various devices. Its Snapdragon platforms power advanced features in smartphones, PCs, and the burgeoning **automotive sector** with the Snapdragon Digital Chassis. Further expanding its reach, Qualcomm's recent acquisition of Alphawave IP Group PLC targets the data center market, enhancing its AI capabilities and high-speed connectivity solutions. These strategic moves position Qualcomm at the forefront of the **high-tech revolution**, capitalizing on the pervasive demand for intelligent and connected experiences.
The company's extensive **patent portfolio**, encompassing over 160,000 patents, forms a critical competitive moat. Qualcomm's lucrative Standard Essential Patent (SEP) licensing program generates substantial revenue and solidifies its influence across global wireless standards, from 3G to 5G and beyond. This intellectual property leadership, combined with a calculated pivot away from its historical reliance on a single major customer like Apple, empowers Qualcomm to pursue new revenue streams. By aiming for a 50/50 split between mobile and non-mobile revenues by 2029, Qualcomm strategically mitigates market risks and secures its position as a diversified technology powerhouse. This assertive expansion, alongside its commitment to dividends, underscores a confident long-term outlook for the semiconductor giant.
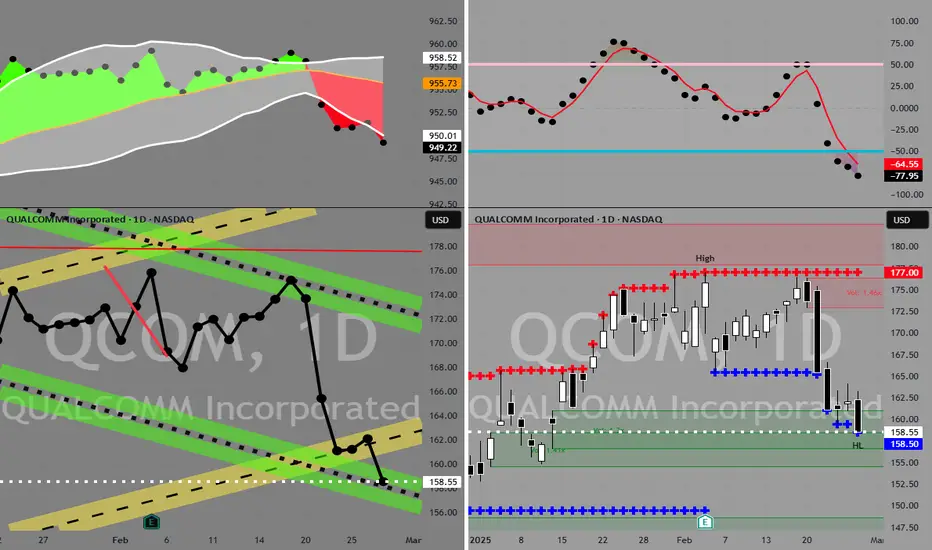
Mean Reversion Trade: QCOM1. RSI in oversold region
2. Price likely to rebound back the the mean
Trade Rules:
Entry Trigger - RSI has cross below oversold region, enter limit buy at close price
Exit Trigger - Close at market when close price cross above exit trigger (Red step line)

Quick View: $ORCL- New setup with lower levels. New bullish crossover on the daily with pullback. It is happening at the resistance of this downward channel. So a big move is expected here

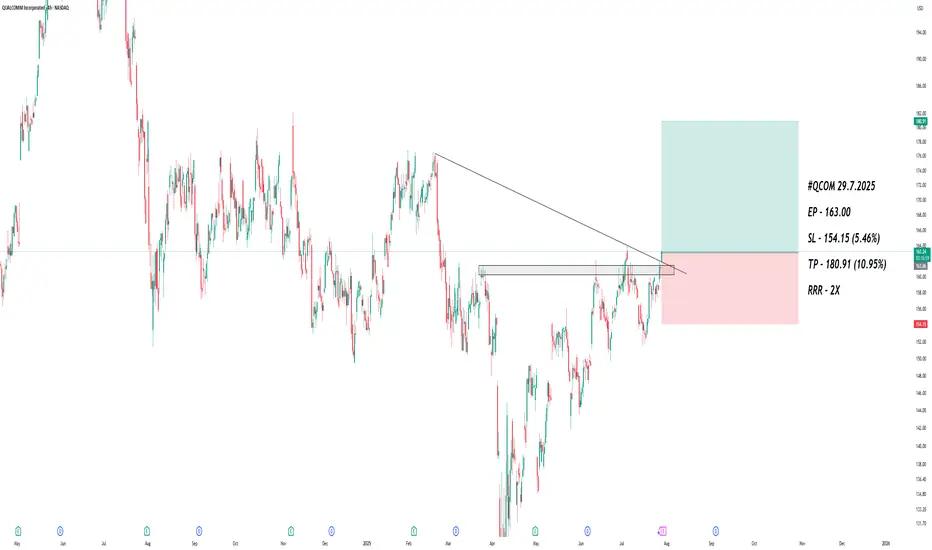
$QCOM | Long SemisIve been looking through semis for trades because they are showing relative strength compared to other sectors. NASDAQ:QCOM is one of my favorites at the moment alongside $MU. I expect this trade to take a while to play out--maybe 6 months or so.

QCOM: Identifying Key Levels for a Potential Bullish ReversalOverview:
The chart for QCOM displays significant price action over the past year-plus, marked by a strong uptrend followed by a substantial correction/consolidation phase. Your drawings highlight critical demand and supply zones, and a potential bullish trade setup.
Historical Price Action (Light Blue Zigzag):
Early 2023 - Mid 2024: Price moved from lows around 100-110, forming a clear impulse wave that rallied aggressively, peaking around $230 in May 2024. This established a strong bullish trend.
Mid 2024 - Early 2025: Following the peak, QCOM entered a significant correction, characterized by a series of lower highs and lower lows, bringing the price back down towards the 120-130 range. This period also saw the price repeatedly reject from an overhead supply zone (dark red rectangle).
Early 2025 - Current: The price found strong demand again in the 120=125 area, leading to a bounce. The current price action indicates a potential reversal attempt, trying to establish a new uptrend by overcoming recent resistance.
Key Zones Identified:
Major Demand Zone (Lower Green Rectangle):
Price Range: Approximately $110 - $125
Interpretation: This is a crucial support area where significant buying interest emerged, causing the price to reverse multiple times. It represents a strong floor for QCOM, acting as a major accumulation zone.
Major Supply/Resistance Zone (Upper Dark Red Rectangle):
Price Range: Approximately $170 - $178
Interpretation: This zone has consistently acted as strong resistance, with sellers stepping in to push the price down whenever it reached these levels. Overcoming this zone would be a significant bullish signal, indicating a potential shift in market structure.
Current Demand/Entry Zone (Upper Green Rectangle):
Price Range: Approximately $155 - $162
Interpretation: The price has recently shown support in this area, bouncing from the lows seen in May 2025. This zone is being targeted as a potential entry point for a new long position. The dashed horizontal line at $159.12 marks the current price or proposed entry level.
Proposed Trade Setup (Right Side Box):
Your chart outlines a potential bullish trade with clear entry, stop-loss, and target levels:
Entry Price: Above 162. This suggests buying into the current strength after bouncing from recent lows.
Stop Loss (Lower Red Rectangle):
Level: $151.51 (bottom of the smaller red box).
Interpretation: Placing the stop loss below the immediate support of the upper green demand zone (and potentially below a previous swing low) indicates that if the price falls below this level, the bullish thesis is invalidated, and it's prudent to exit the trade to limit losses.
Main Target (Light Blue Dotted Rectangle):
Level: $182.63
Interpretation: This is the ultimate profit target, suggesting a potential move back towards, or even slightly above, the major supply zone (dark red rectangle). This target implies a successful breakout from the recent consolidation and a challenge of prior highs. The dotted line illustrates the projected path towards this target.
Risk/Reward: 1:3
Conclusion:
QCOM is currently situated within a key demand zone after a significant correction. The setup suggests a potential bullish reversal with a defined entry, stop loss, and attractive risk-reward profile targeting a retest of higher resistance levels. Traders should monitor price action carefully for confirmation of strength within the current demand zone and watch for a decisive break above the major supply zone for sustained upside.
Disclaimer:
The information provided in this chart is for educational and informational purposes only and should not be considered as investment advice. Trading and investing involve substantial risk and are not suitable for every investor. You should carefully consider your financial situation and consult with a financial advisor before making any investment decisions. The creator of this chart does not guarantee any specific outcome or profit and is not responsible for any losses incurred as a result of using this information. Past performance is not indicative of future results. Use this information at your own risk. This chart has been created for my own improvement in Trading and Investment Analysis. Please do your own analysis before any investments.


Quick View: $QCOM(daily) Consolidation with Bullish Crossover
(weekly), still bearish.
This is a very early signal
Watching $155 as key resistance.
Support → $133

QCOMan upward trend in the prices of an industry's stocks or the overall rise in broad market indices, characterized by high investor confidence
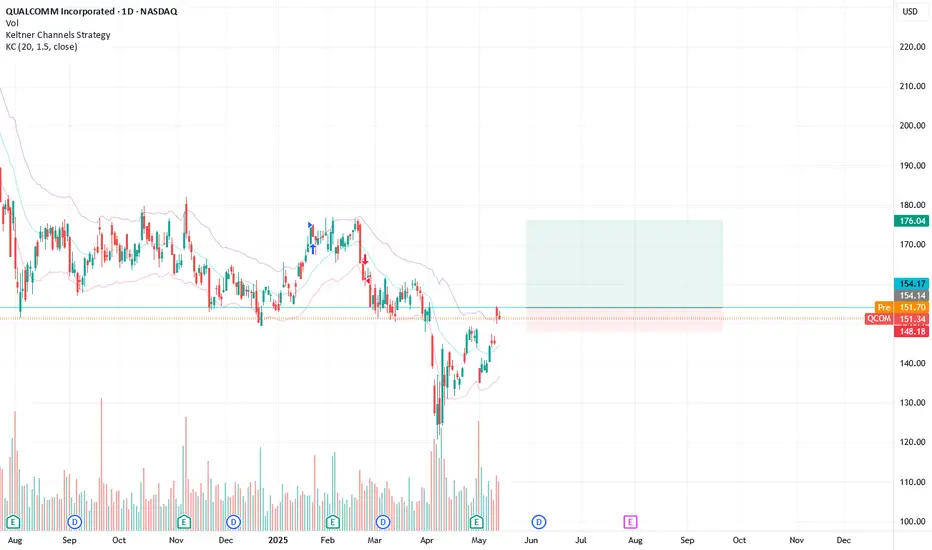
Qualcomm Remains BullishLike the market as a whole, Qualcomm shares recovered significantly. With the downward movement on May 1, which many market participants interpreted as a continuation of the bearish trend, the share delivered a precise 50% correction. This should not be seen as bearish, but rather gives hope for further price rises.
We have drawn a conservative and an aggressive take profit for a long position in the chart here.

QCOM Q1 EARNINGSQCOM is currently between two strong resistance levels above, and has solid support around the 120 level. If earnings are strong and he beats expectations, it's very likely the price will retest the upper range. If earnings miss, it would likely drop down to the double bottom.

QCOM in Buy ZoneMy trading plan is very simple.
I buy or sell when at three of these events happen:
* Price tags the top or bottom of parallel channel zones
* Money flow spikes beyond it's Bollinger Bands
* Stochastic Momentum Index (SMI) at near oversold overbought level
* Price at Fibonacci levels
So...
Here's why I'm picking this symbol to do the thing.
Price in buying zone at bottom of channels
Stochastic Momentum Index (SMI) at oversold level
Money flow momentum is spiked negative and under at bottom of Bollinger Band
Entry at $158.5
Target is upper lower channel around $172
QCOM eyes on $158.81: Key Resistance to break and resume UpTrendChips have been suffering under the uncertainty of Trump.
QCOM had some good news that might help it paint a bottom.
$ 158.29-158.81 is key resistance for bulls to flip into support.
======================================================
.

QCOM 3d Chart, 1H 2025Publishing the NASDAQ:QCOM chart to keep an eye on it. If this follows a similar path to NASDAQ:SOXX and NASDAQ:SMH , this could have some downside coming up.
The chart has been one of the stronger semis, so not convinced, hence would like to track it.

QCOM cautiously bullish 4h timeframe multi timeframe confirmation just dropped in my lap.
I see strong BUY confirmation based on our momentum framework.
🔹 **Trade Direction:** Long (Bullish Reversal)
🔹 **Entry:** $156 - $157 (Current zone)
🔹 **Stop Loss:** $152 (below recent swing low)
🔹 **Target 1:** $164 (short-term resistance)
🔹 **Target 2:** $171.50 (previous support-turned-resistance)
📊 **Probability & Justification:**
- **Momentum Shift:** Price stabilizing after a steep sell-off, potential for mean reversion.
- **Indicators:** Stochastic RSI heavily oversold across all key timeframes, strong buy signals on multiple intervals.
- **Moving Averages:** 9/21 EMA still bearish, but price attempting to reclaim key levels.
- **Volume Profile:** Increasing buy-side pressure indicates accumulation.
⚠️ **Risk Considerations:**
- A break below $152 invalidates the setup.
- Price action must confirm a higher low before strong upside.
- Volatility at 31.5%—expect swings; patience required.
📉 **Bias:** Cautiously bullish—confirmation needed for continuation above $164.

QCOM SL-$171,24 TP-$176,31Technical Analysis:
Accumulation
Daily 50-200 EMA Crossover
MACD Crossover on H4

Trading idea - Entry point > 174/61.80%Trading Idea
1) Find a FIBO slingshot
2) Check FIBO 61.80% level
3) Entry Point > 174/61.80%
Chart time frame: D
A) 15 min(1W-3M)
B) 1 hr(3M-6M)
C) 4 hr(6M-1year)
D) 1 day(1-3years)
Stock progress: B
A) Keep rising over 61.80% resistance
B) 61.80% resistance
C) 61.80% support
D) Hit the bottom
E) Hit the top
Stocks rise as they rise from support and fall from resistance. Our goal is to find a low support point and enter. It can be referred to as buying at the pullback point. The pullback point can be found with a Fibonacci extension of 61.80%. This is a step to find entry level. 1) Find a triangle (Fibonacci Speed Fan Line) that connects the high (resistance) and low (support) points of the stock in progress, where it is continuously expressed as a Slingshot, 2) and create a Fibonacci extension level for the first rising wave from the start point of slingshot pattern.
When the current price goes over 61.80% level , that can be a good entry point, especially if the SMA 100 and 200 curves are gathered together at 61.80%, it is a very good entry point.
As a great help, tradingview provides these Fibonacci speed fan lines and extension levels with ease. So if you use the Fibonacci fan line, the extension level, and the SMA 100/200 curve well, you can find an entry point for the stock market. At least you have to enter at this low point to avoid trading failure, and if you are skilled at entering this low point, with fibonacci6180 technique, your reading skill to chart will be greatly improved.
If you want to do day trading, please set the time frame to 5 minutes or 15 minutes, and you will see many of the low point of rising stocks.
If want to prefer long term range trading, you can set the time frame to 1 hr or 1 day.

Qualcomm Incorporated (QCOM) In November 2024, Qualcomm outlined plans to diversify beyond smartphone processors, targeting $4 billion in annual revenue from its personal-computer business by 2029. This strategy aims to challenge industry leaders like Intel and AMD. The company also seeks to generate an additional $22 billion annually over five years by expanding into PCs, vehicles, and the Internet of Things (IoT). This diversification is crucial as Qualcomm anticipates a reduction in business from Apple, which is expected to transition to in-house modem chips for its iPhones.
In October 2024, Qualcomm introduced the Snapdragon 8 Elite, a new processor featuring the custom Oryon CPU cores. This release marks Qualcomm's first custom microarchitecture for smartphone SoCs since the original Kryo cores.

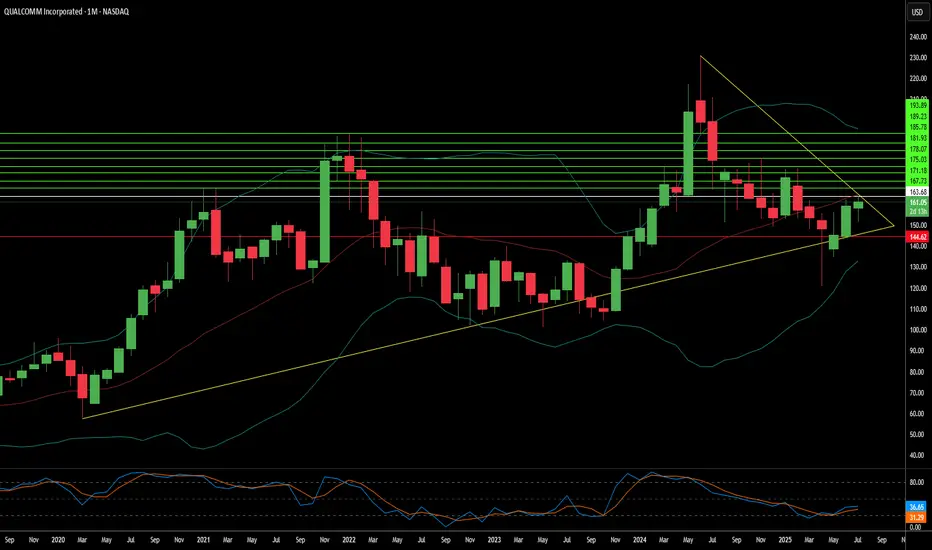
Qualcomm: Target Zone Active!QCOM is still trading outside our blue Target Zone, which spans from $159.57 to $121.52. While the stock has fulfilled the technical minimum requirement for the blue wave (IV) by reaching this range, we primarily expect further sell-offs and lower lows before the correction is complete. A premature breakout will only be confirmed if the price sustainably surpasses the $182.08 mark (37% likely).

Breaking: QUALCOMM ($QCOM) Shares Dip 5% In Premarket tradingShares in Qualcomm fell more than 5% in Thursdays premarket trading as a disappointing forecast for no growth in its patent licensing business overshadowed a higher-than-expected outlook for sales and profits.
The shares fell 4.2% in extended trading on Wednesday, having closed up 1.6% on the day in regular hours. Qualcomm stock is up 14.5% this year.
Despite the poor results It is pertinent to note that In 2024, QUALCOMM's revenue was $38.96 billion, an increase of 8.77% compared to the previous year's $35.82 billion. Earnings were $10.14 billion, an increase of 40.24%.
Analyst Forecast
According to 27 analysts, the average rating for QCOM stock is "Buy." The 12-month stock price forecast is $207.25, which is an increase of 17.85% from the latest price.
Technical Outlook
As of the time of writing, (NASDAQ: NASDAQ:QCOM ) stock is down 5.11% in Thursday's premarket trading with recent trading session closing with a moderate RSI of 66 however there will be an impediment today on the growth of NASDAQ:QCOM as a gap down is inevitable which is a bearish pattern that leads to further dip.
In the case of extreme selling pressure, immediate support lies in the 61.8% fib retracement level. A dip to this could set NASDAQ:QCOM on a bullish course as liquidity has being swept on recent dip.

QCOM: High-Probability, 1to5 Risk/Reward SetupQCOM has gapped up into a significant resistance area and is now testing its 200 EMA, a key technical level that often draws attention from institutional traders, who are able to move the price significantly. Then you have the general public FOMO, who are long because last year was 'so good'. This creates an attractive risk/reward trade opportunity.
For Chart Enthusiasts: A potential head-and-shoulders pattern is forming:
Left shoulder: March 2024.
Head: All-time high on June 18, 2024, at $230.
Right shoulder: The current price action, which appears to be breaking lower.
For the Normal People In simple terms: QCOM established a base around $160 in March 2024.
It rallied sharply, reaching $230 within a few months.
Now, 10 months later, the price has returned to where it began, with heavy trading activity as buyers and sellers clash:
Buyers: Believe this level will hold and the price will rebound.
Sellers (like me): Expect this level won’t hold, and the price will drop further.
My Position:
I got short here with a stop-loss just above the 200 EMA and targeting mid to low 150s (that is actually more then 1to5 R/R)
This risk/reward setup is very appealing, especially if we see weakness in the broader market or the semiconductor sector. (That "if" is the key point. If not, i'll be very quick to cover).
Navigate with care,
OnlyTrade2Win.

Qualcomm - very close to key turning pointsQualcomm has broad market share, strong profitability and '25 analyst targets around $200.
However, there are some key indicators noted that suggest a decline in the short term.
