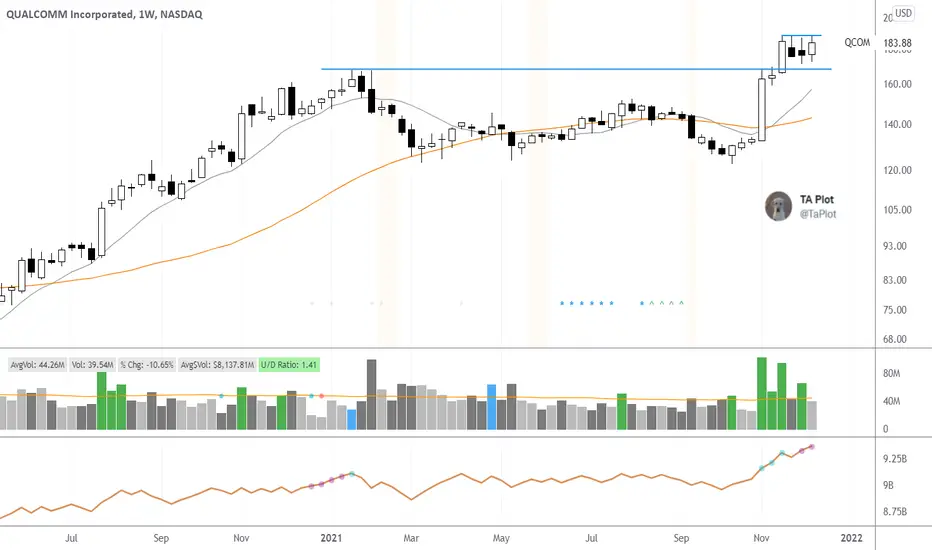
$QCOM Looking Strong$QCOM looking real good. Not my typical VCP since its already out of its base but tight daily trading none the less.
The weekly (2nd chart) is what caught my attention. that these skyscraper volume on that breakout.
QCI trade ideas

QCOM - Inside Day BreakoutQCOM looking to breakout to above the inside day and push higher than the trend line,. Looking to take calls above $185

$QCOM - Flagging, calls > 185 | puts < 180$QCOM - Flagging, calls > 185 | puts < 180
- Daily inside candle formed
- Daily flagging
- Daily holding 5ema

11/28/21 QCOMQUALCOMM Incorporated ( NASDAQ:QCOM )
Sector: Electric Technology (Telecommunications Equipment)
Current Price: $175.74
Breakout price trigger: $181.00
Buy Zone (Top/Bottom Range): $172.00-$165.00
Price Target: $196.00-$200.00
Estimated Duration to Target: 61-69d
Contract of Interest: $QCOM 2/18/22 200c
Trade price as of publish date: $5.40/contract

QCOM Similar pointsOn this chart I have used Gann and a Parallel channel to display two similar points in the evolution of QCOMS value
Where the green Gann fan and Parallel channel meet through the uptrend can be considered similar both because of there place on the chart, and price action
Using this I have plotted a white Bars pattern, where I expect price to move to
Using the MavilimW indicator, it can be seen within both wedges , the indicator becomes very unstable, swinging between up and down
Perhaps an intrinsic property of the Wedge pattern
This is the weekly chart for QCOM

QUALCOMM WAVE ANALYSISThis is an update of the earlier video on Qualcomm, I hope this will be appreciated by the viewers and people trading in the stock. this is only for educational purposes.

WAVE ANALYSIS OF QUALCOMMI have made a short video of wave analysis on the Qualcomm stock, lets see what happens tomorrow. this is only for educational purposes.

Qcom heading to 200Qcom may reach 201 level soon after the recent breakout and solid fundamentals. The strong revenue guidance from the diversified business.

QCOM Algo Levels🚨 QCOM 190C above 183.76
Options Code: .QCOM211119C190
Cost: $1.44
Algo PT: 185.19, 186.19, 187.19
Algo SL: 181.94 using 5m or 15m"
thetradesetup.com

Long | QCOM | Intraday 11/16/21NASDAQ:QCOM
Possible Scenario: LONG
Evidence: Price Action , Dark pool activity, Options flow.
Entry point: current price, it can drop more but not important.
TP1: 176$
Call options 12/17/21 strike 170$
Call options 11/19/21 strike 172.5$
*This is my idea and could be wrong 100%.

Cup and Handle (s)Irice is over top band with SMA on 80.
Price may chill shortly, who knows but there is an unfilled gap and borderline overbought with RSI on 80. A lot of momentum noted
No recommendation
QCOM has broken long entry for lower/smaller cup and handle and is fighting resistance from the cup top for a break from the larger cup and handle pattern/probable pull back in time.
I am Long QCOM.

Qcom to consolidate moreQcom has basically traded sideways since January 2021 after a major rally in 2020.
Now here we are this week coming off a spectacular earnings , which sent Qcom soaring back to ATH and we still couldn't start a new uptrend even with the help of AMD and NVDA pushing the chip sector higher. I think we don't necessarily have to fall back to 122 demand zone but I do think we range trade between 151 and ATH for awhile
Also Tuesday we closed with a DoJi star candlestick, today confirmed the doji reversal 🐻

QCOM Crossing 166.80 Tons of flo and dark pool flo.QCOM Crossing 166.80
Tons of flo and dark pool flo.


$QCOMIf it can close above the weekly candle 168.55 and hold 166 expect to see ATH in a (BLNK) of a eye see what I did there. .. But forreal tho..
ibb.co darkpool
ibb.co option data

QCOMBullish Bat & Crab near trend line and support, the rest of this is filler to fit minimum description

QCOM - This won't end well short term - RSI overboughtRSI indicator showing that QCOM is overbought on the 4H chart. We see a retracement to $140
For educational purposes only.

QCOM - VerticalPressed Put Positions @ higher Levels.
QCOM - DEC - JAN Put Spread
135 x 25
140 x 25
145 x 25
150 x 25
155 x 10
160 x 10
Needless to say, early Puts were smoked.
We increased these by 150% and will continue
to add into next Tuesday.
1 - Equity trade 1.5 x 141.00 closed @ 153.30.
$QCOM | UPDATEAll targets HIT and gap nearly filled after a monster move from earnings! Idea was shared when QCOM was trading at just $130 resulting in over 20% move in equity.
Congrats if anyone played this one!!

Qcom looks bullishEarnings is today over 137 is a breakout of the bullish megaphone .. We all know this is earnings and can go either way..

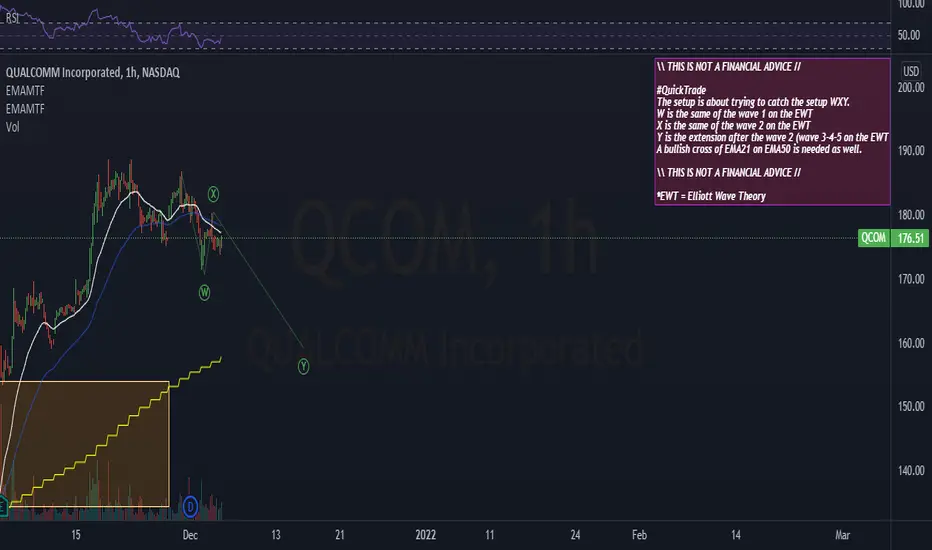
$QCOM | WEEKLY WATCHLIST 11/1 Didn't have time to do a full Elliot Wave Theory analysis on this one, I apologize for that. However, very clear supply/demand zones labeled, while trading within a wedge. Extremely attractive bullish inverse head & shoulders shown on the chart, looking to potentially confirm and breakout early in the week.
The only thing holding me back from this is the fact that Qualcomm reports earnings on November 3rd. Setup is extremely good on this one, so I may make an exception and possibly day trade this one before earnings. Not looking to swing until after earnings is reported.
