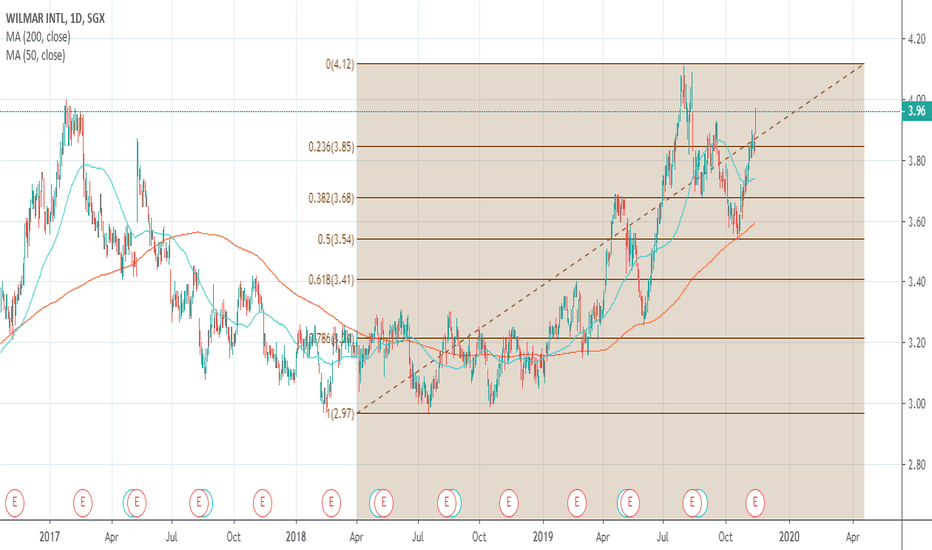
Trading Strategy for Wilmar1. Trend Analysis
Trading range to breakout higher in channel
2. Indicator Analysis
Above 200 daily SMA now turned support ( Bullish )
Sell signal from MACD with support of negative momentum from stoch (bearish)
High volume coupled with previous gap down(bearish)
3. Candlestick Analysis
NA
4. Pattern Analysis
-> ABCD pattern could be present if uptrend channel breaks
-> Buyer Holds uptrend channel and continue further
Trading Plan
1. Trade against the flow with shortist
Wait for a weekly close below the uptrend channel for entry
SL: Prior high at 5 , double top formation
TP(1):4.11
TP(2): 3.38
Remark: You need to monitor and trail it closely.
2. Go with the flow ( ABCD pattern)
Long Entry @ 3.64 when reversal candle happens
S:: 2.82
TP:5.3
Enter a short position if reversal happens at 5.3
Please DYODD
RTHA trade ideas
Wilmar sell down after wave 4The strong sell down March 2020 has confirmed the bearish impulse of the 5 wave structure. Based on the Technical, we believe that the stock bullish correction is coming to an end:
1. Rising wedge formation below 50% Fibonacci retracement level indicate a strong signal to sell.
2. Evening star formation below the 50% Fibonacci retracement level indicate the start of a bearish sell down. Looking closer, the cluster of candles with the evening star formation indicate a weakness when all three candles fails to break the recent top at 3.48.
3. Elliott wave (iv) complied with the theory’s rule, whereby price should display a reversal at the 50% retracement of wave (iii).
4. Prices has been trending below the 200 and 50 Moving averages. On top of that, the 50 moving average crosses below the 200 moving average has formed a death cross and it is still valid.
5. RSI indicate a bearish divergence.
WILMAR (F34) - Opportunity to BUYHey everyone, here's the analysis on Wilmar, if you found this insightful, please like and leave a comment on ideas you would like to see next!
Summary:
As illustrated by the yellow dotted lines, I am expecting a drop in current price to zone 2 at the 3.22 area highlighted in green, before moving higher to our resistance zone between 3.73 - 3.81.
Action:
Buy Limit: 3.22
Stop Loss: 3.00
Take Profit: 3.73
Analysis:
Zone 2 is in line with a key level on the weekly chart and the 38.2% retracement. If current price holds well above zone 2, it could rally to zone 3 highlighted in red, between 3.73 - 3.81. The resistance zone 3 is a key breakout zone, hence we will not play a move beyond that.
Disclaimer: There is a very high degree of risk involved in trading and investing. Past results are not indicative of future returns. Trading BEAN and all individuals affiliated with this site assume no responsibilities for your trading and investment results. All contents featured here are solely for educational purposes and ARE NOT investment or trading advices. Please do your own due diligence and trade at your own risk.
Wilmar International channel formation Stock Wilmar international trading in tight channel range from 3.00 to 3.30.
As per price pattern and candlestick analysis stock can side further to test level of 3.00 where lower end of channel act as support .
Closing below 3.00 with volume can open down side in stock.


