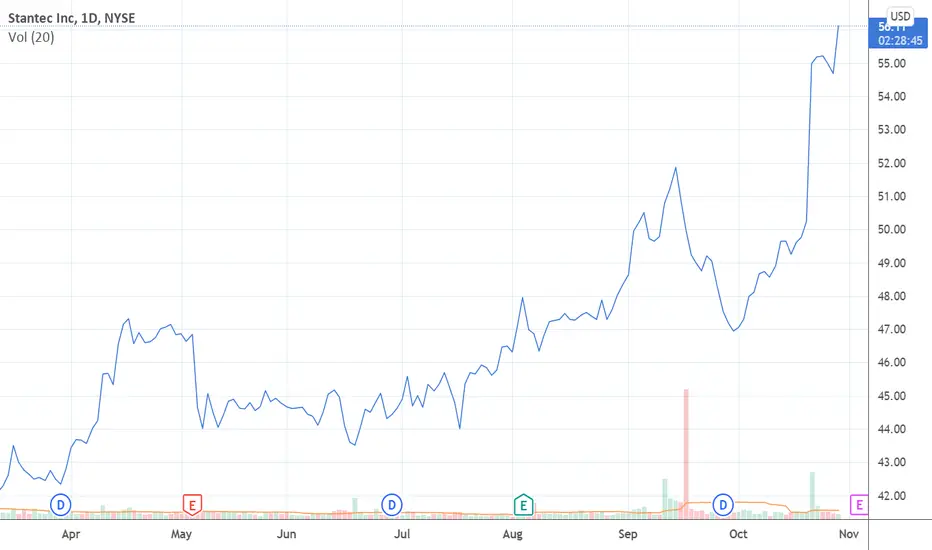
Stantec and Kleinfelder awarded Architecture-Engineering ContracSTN: Stantec
2021-10-28 06:45:00
Stantec and Kleinfelder awarded Architecture-Engineering Contract for Dam/Levee Safety by the US Army Corps of Engineers
Next report date
—
Report period
—
EPS estimate
—
Revenue estimate
—
2.0 EUR
242.66 M EUR
5.03 B EUR
113.50 M
About STANTEC INC
Sector
Industry
CEO
Gordon Allan Johnston
Website
Headquarters
Edmonton
Founded
1954
FIGI
BBG000C0PJN1
Stantec, Inc. engages in the provision of knowledge-based solutions through value-added professional consulting services in engineering, architecture, interior design, landscape architecture, surveying, environmental sciences, project management, and project economics. It operates through the following geographical segments: Canada, United States, and Global. The company was founded by Don Stanley in 1954 and is headquartered in Edmonton, Canada.

Summarizing what the indicators are suggesting.
Neutral
SellBuy
Strong sellStrong buy
Strong sellSellNeutralBuyStrong buy
Neutral
SellBuy
Strong sellStrong buy
Strong sellSellNeutralBuyStrong buy
Neutral
SellBuy
Strong sellStrong buy
Strong sellSellNeutralBuyStrong buy
An aggregate view of professional's ratings.
Neutral
SellBuy
Strong sellStrong buy
Strong sellSellNeutralBuyStrong buy
Neutral
SellBuy
Strong sellStrong buy
Strong sellSellNeutralBuyStrong buy
Neutral
SellBuy
Strong sellStrong buy
Strong sellSellNeutralBuyStrong buy
Displays a symbol's price movements over previous years to identify recurring trends.
Curated watchlists where S3A is featured.

Related stocks
Frequently Asked Questions
The current price of S3A is 92.5 EUR — it has increased by 1.12% in the past 24 hours. Watch STANTEC INC. stock price performance more closely on the chart.
Depending on the exchange, the stock ticker may vary. For instance, on FWB exchange STANTEC INC. stocks are traded under the ticker S3A.
S3A stock has risen by 2.27% compared to the previous week, the month change is a 20.00% rise, over the last year STANTEC INC. has showed a 26.71% increase.
We've gathered analysts' opinions on STANTEC INC. future price: according to them, S3A price has a max estimate of 105.75 EUR and a min estimate of 89.73 EUR. Watch S3A chart and read a more detailed STANTEC INC. stock forecast: see what analysts think of STANTEC INC. and suggest that you do with its stocks.
S3A stock is 2.70% volatile and has beta coefficient of 0.94. Track STANTEC INC. stock price on the chart and check out the list of the most volatile stocks — is STANTEC INC. there?
Today STANTEC INC. has the market capitalization of 10.50 B, it has increased by 3.09% over the last week.
Yes, you can track STANTEC INC. financials in yearly and quarterly reports right on TradingView.
STANTEC INC. is going to release the next earnings report on Aug 6, 2025. Keep track of upcoming events with our Earnings Calendar.
S3A earnings for the last quarter are 0.75 EUR per share, whereas the estimation was 0.70 EUR resulting in a 5.88% surprise. The estimated earnings for the next quarter are 0.87 EUR per share. See more details about STANTEC INC. earnings.
STANTEC INC. revenue for the last quarter amounts to 997.45 M EUR, despite the estimated figure of 990.71 M EUR. In the next quarter, revenue is expected to reach 1.05 B EUR.
S3A net income for the last quarter is 64.29 M EUR, while the quarter before that showed 65.78 M EUR of net income which accounts for −2.27% change. Track more STANTEC INC. financial stats to get the full picture.
Yes, S3A dividends are paid quarterly. The last dividend per share was 0.15 EUR. As of today, Dividend Yield (TTM)% is 0.59%. Tracking STANTEC INC. dividends might help you take more informed decisions.
STANTEC INC. dividend yield was 0.74% in 2024, and payout ratio reached 26.51%. The year before the numbers were 0.73% and 27.41% correspondingly. See high-dividend stocks and find more opportunities for your portfolio.
As of May 29, 2025, the company has 32 K employees. See our rating of the largest employees — is STANTEC INC. on this list?
EBITDA measures a company's operating performance, its growth signifies an improvement in the efficiency of a company. STANTEC INC. EBITDA is 645.67 M EUR, and current EBITDA margin is 12.75%. See more stats in STANTEC INC. financial statements.
Like other stocks, S3A shares are traded on stock exchanges, e.g. Nasdaq, Nyse, Euronext, and the easiest way to buy them is through an online stock broker. To do this, you need to open an account and follow a broker's procedures, then start trading. You can trade STANTEC INC. stock right from TradingView charts — choose your broker and connect to your account.
Investing in stocks requires a comprehensive research: you should carefully study all the available data, e.g. company's financials, related news, and its technical analysis. So STANTEC INC. technincal analysis shows the strong buy rating today, and its 1 week rating is buy. Since market conditions are prone to changes, it's worth looking a bit further into the future — according to the 1 month rating STANTEC INC. stock shows the strong buy signal. See more of STANTEC INC. technicals for a more comprehensive analysis.
If you're still not sure, try looking for inspiration in our curated watchlists.
If you're still not sure, try looking for inspiration in our curated watchlists.