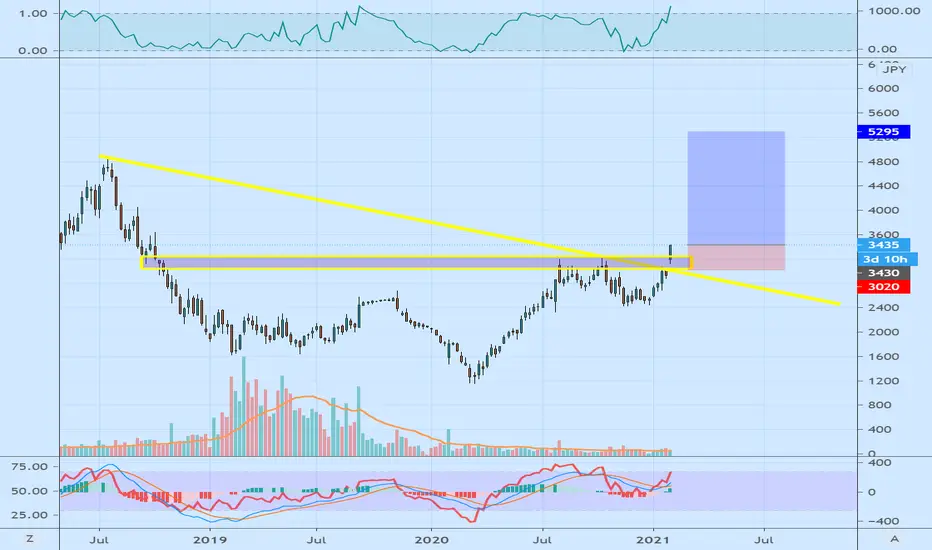
Zozotown the king of fashion website in JapanCup and handle pattern
The breakaway gap confirming the bullishness
Fairly good risk reward ratio
###NOT FINANCIAL ADVICE###
Next report date
—
Report period
—
EPS estimate
—
Revenue estimate
—
0.30 EUR
279.41 M EUR
1.31 B EUR
417.97 M
About ZOZO INC
Sector
Industry
CEO
Kotaro Sawada
Website
Headquarters
Chiba
Founded
1998
ISIN
JP3399310006
FIGI
BBG005JYVLZ4
ZOZO, Inc. engages in the electronic commerce (EC) business. It operates through the following business divisions: ZOZOTOWN Business, Yahoo! Shopping, BtoB, Advertising, and Others. The ZOZOTOWN Business division provides a fashion shopping site called ZOZOTOWN and branded clothes shop called ZOZOUSED. The Yahoo! Shopping business division opens a store on Yahoo! Shopping, an online shopping mall operated by Yahoo Corporation, and sells products. The BtoB division manages the sale, system development, design, production, logistics contractor, and marketing support of the EC (electronic commerce) sites. The Advertising division provides the fashion co-ordination services site called Wear. The Others division covers the incidentals of ZOZOTOWN business. The company was founded by Yusaku Maezawa on May 21, 1998 and is headquartered in Chiba, Japan.
Related stocks
Summarizing what the indicators are suggesting.
Neutral
SellBuy
Strong sellStrong buy
Strong sellSellNeutralBuyStrong buy
Neutral
SellBuy
Strong sellStrong buy
Strong sellSellNeutralBuyStrong buy
Neutral
SellBuy
Strong sellStrong buy
Strong sellSellNeutralBuyStrong buy
An aggregate view of professional's ratings.
Neutral
SellBuy
Strong sellStrong buy
Strong sellSellNeutralBuyStrong buy
Neutral
SellBuy
Strong sellStrong buy
Strong sellSellNeutralBuyStrong buy
Neutral
SellBuy
Strong sellStrong buy
Strong sellSellNeutralBuyStrong buy
Displays a symbol's price movements over previous years to identify recurring trends.
Frequently Asked Questions
The current price of SAR is 8.20 EUR — it has decreased by −8.89% in the past 24 hours. Watch ZOZO INC. stock price performance more closely on the chart.
Depending on the exchange, the stock ticker may vary. For instance, on FWB exchange ZOZO INC. stocks are traded under the ticker SAR.
SAR stock has fallen by −1.80% compared to the previous week, the month change is a −4.09% fall, over the last year ZOZO INC. has showed a −1.60% decrease.
We've gathered analysts' opinions on ZOZO INC. future price: according to them, SAR price has a max estimate of 12.21 EUR and a min estimate of 5.81 EUR. Watch SAR chart and read a more detailed ZOZO INC. stock forecast: see what analysts think of ZOZO INC. and suggest that you do with its stocks.
SAR stock is 9.76% volatile and has beta coefficient of 0.44. Track ZOZO INC. stock price on the chart and check out the list of the most volatile stocks — is ZOZO INC. there?
Today ZOZO INC. has the market capitalization of 7.69 B, it has decreased by −3.03% over the last week.
Yes, you can track ZOZO INC. financials in yearly and quarterly reports right on TradingView.
ZOZO INC. is going to release the next earnings report on Oct 30, 2025. Keep track of upcoming events with our Earnings Calendar.
SAR earnings for the last quarter are 0.08 EUR per share, whereas the estimation was 0.07 EUR resulting in a 0.82% surprise. The estimated earnings for the next quarter are 0.07 EUR per share. See more details about ZOZO INC. earnings.
ZOZO INC. revenue for the last quarter amounts to 318.25 M EUR, despite the estimated figure of 314.20 M EUR. In the next quarter, revenue is expected to reach 302.89 M EUR.
SAR net income for the last quarter is 67.01 M EUR, while the quarter before that showed 57.94 M EUR of net income which accounts for 15.66% change. Track more ZOZO INC. financial stats to get the full picture.
ZOZO INC. dividend yield was 2.49% in 2024, and payout ratio reached 70.07%. The year before the numbers were 2.73% and 70.18% correspondingly. See high-dividend stocks and find more opportunities for your portfolio.
As of Aug 2, 2025, the company has 1.76 K employees. See our rating of the largest employees — is ZOZO INC. on this list?
EBITDA measures a company's operating performance, its growth signifies an improvement in the efficiency of a company. ZOZO INC. EBITDA is 418.31 M EUR, and current EBITDA margin is 32.61%. See more stats in ZOZO INC. financial statements.
Like other stocks, SAR shares are traded on stock exchanges, e.g. Nasdaq, Nyse, Euronext, and the easiest way to buy them is through an online stock broker. To do this, you need to open an account and follow a broker's procedures, then start trading. You can trade ZOZO INC. stock right from TradingView charts — choose your broker and connect to your account.
Investing in stocks requires a comprehensive research: you should carefully study all the available data, e.g. company's financials, related news, and its technical analysis. So ZOZO INC. technincal analysis shows the sell today, and its 1 week rating is sell. Since market conditions are prone to changes, it's worth looking a bit further into the future — according to the 1 month rating ZOZO INC. stock shows the neutral signal. See more of ZOZO INC. technicals for a more comprehensive analysis.
If you're still not sure, try looking for inspiration in our curated watchlists.
If you're still not sure, try looking for inspiration in our curated watchlists.