Sage Group (The) PLC (SGE) | Chart & Forecast SummaryKey Indicators on Trade Set Up in General
1. Push Set Up
2. Range Set up
3. Break & Retest Set Up
Active Sessions on Relevant Range & Elemented Probabilities;
* Asian(Ranging) - London(Upwards) - NYC(Downwards)
* Weekend Crypto Session
# Trend | Time Frame Conductive | Weekly Time Frame
- General Trend
- Measurement on Session
* Support & Resistance
* Trade Area | Focus & Motion Ahead
# Position & Risk Reward | Daily Time Frame
- Measurement on Session
* Retracement | 0.5 & 0.618
* Extension | 0.786 & 1
Conclusion | Trade Plan Execution & Risk Management on Demand;
Overall Consensus | Buy
SGK1 trade ideas

5 years for Sage to break out?It's taken 5 years for Sage to break out from 824 resistance. Good results today have seen the price initially increase by about 4%. Let's see if this is a true break or a bull trap as it was in Dec 2021.
Looks bullish to me but do your own research and this is not a recommendation to trade.

Is this Sage's moment to breakout?Will Sage breakout of its 817 resistance, which has held for almost 5 years?

A move that might have begunIt's been a while since the stock declined in what could be the final E leg down.
Expect it to progress towards 900 now.

Accumulation of SGE at the end of correction.SGE published worse than expected numbers which triggered a 13% sell-off. It is likely the end of a corrective Wave 2. Time to start buying at this 580-ish levels to get on coming Wave 3 train.


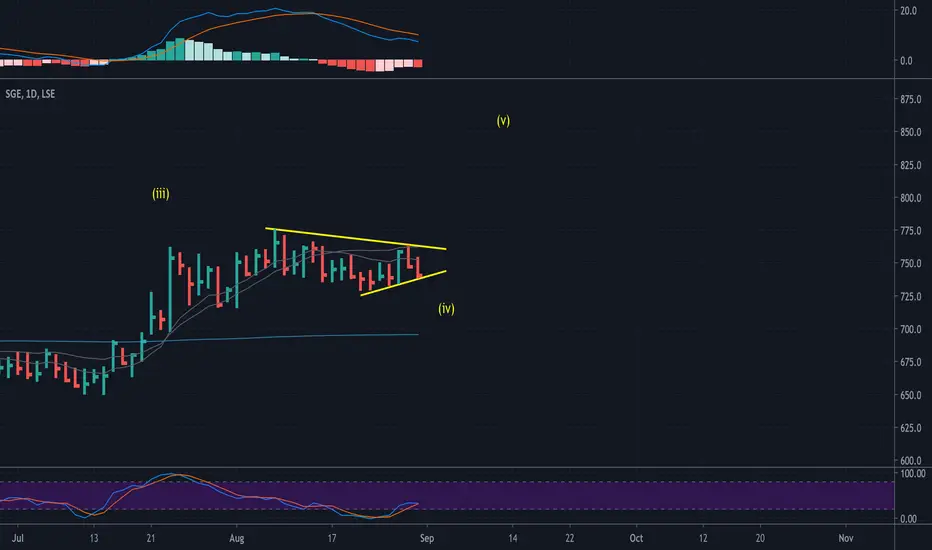
SGE - Extended wave 4FOR INFO ONLY - NOT TRADING ADVICE
Could be a very long consolidation of wave 4. Long wave 4 means large pop up!

SGE - Sage Group - Potential buyFollowing a brutal sell off recently rolling a CEO step down, now could be the time for a long entry on SGE.
Looking at an entry above Fridays high.
Technical points:
Engulfing bar on strong volume
Rejection from lower Fib
RSI 2 oversold
May be good for a bounce.
SL: 560
TP1: 608
TP2: 630

Sage Group ready to roll over?We are on the hunt for short ideas as we expect to see some form of pullback in equities in the short term. Sage Group is in a long term downtrend and has underperformed the benchmark index over the past 1-3 months on a relative basis. The shares have rallied into downtrend resistance as well as a combination of the 50 & 200 day moving average. There was also a bearish engulfing candle on Tuesday. We therefore expect to see this fall in the short term. Stop loss at 667p, targeting a move to retest the recent lows around 620p


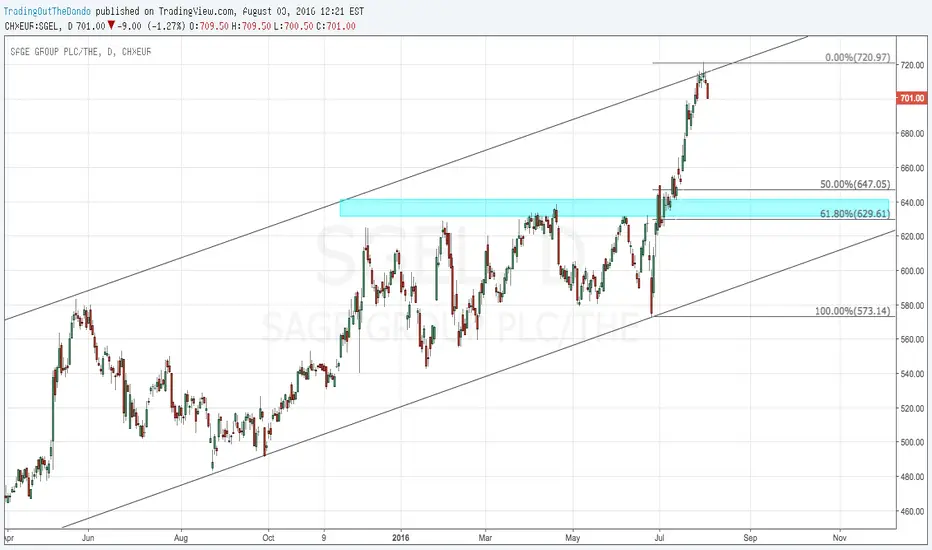
sage group shortexpecting a correction of this sharp rally down to the 50% fib at least
Confluences: low volume resistance turned support level price finally broke through could act as magnet
current channel rejection off resistance
doji/hammer rejection on daily into a heavy daily sell off indicative of bears entering the market
Target 650