Price is About to Breakout the Major High with EMA Signal SupporBoth EMA12 and EMA26 in the weekly and monthly timeframes are showing bullish signals. Prices have been consolidating for 1078 days, indicating a potential breakout. Since September last year, volumes have decreased, suggesting a buildup of pressure. Currently, the price is breaking through a Low Volume Node (LVN) area to the left, which could lead to a significant move upwards.
TFBF trade ideas

"KBANK" wait for buy
117 level is recommend to Buy .
Time CY Day 144 bar .
if FIBO at 78.6 can support .
If not , It will be down trend !!!

KBANK | Elliott Wave - Wave 4 Support - Target Bull Pennant +30%Price action and chart pattern trading setup
> Overall wave pattern moving in diagonal uptrend with a possible wave 4 triangle sideway.
> Now making a strong pullback to triangle support could be E- wave of ABCDE pattern at EMA200W zone
> Entry : A false triangle breakdown for a possible long entry between S1 and possible S2
> Target : bullish pennant at major wave 5 diagonal zone +30%.
> Stop: Slightly below S2 -5%
Always trade with affordable risk and respect your stoploss
Good Luck

KBANK : Wait and see
Time Cycle will be 55 week soon
Impotant Fibo at 129 - 130 Baht (61.8)
MACD still negative
That can buy if have backward sinal
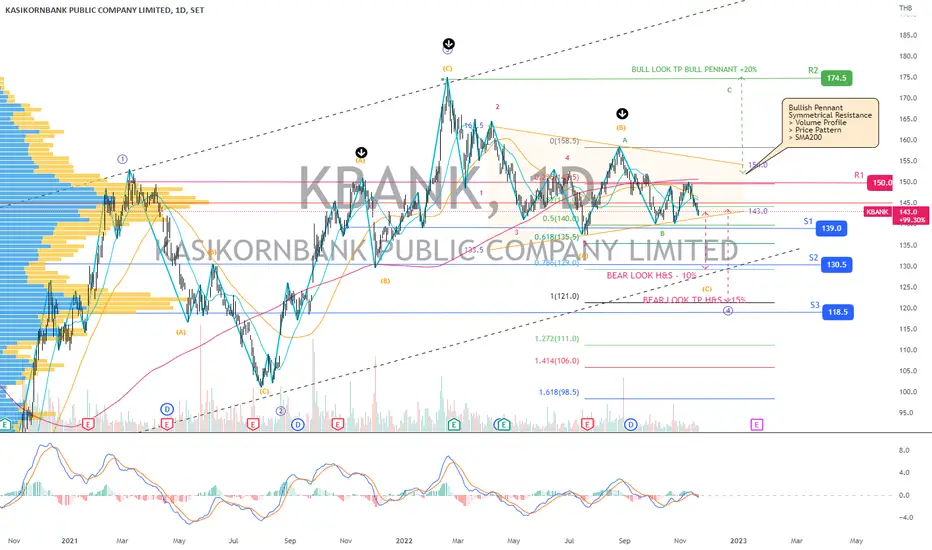
KBANK | Wave Analysis | Bearish Projection Diagonal 4-wavePrice action and chart pattern trading
> A 2 conflicting pattern with a bearish move from the larger Head & Shoulders pattern and a bullish one with current bull pennant.
> The larger HS pattern could be overshadowing the smaller pennant pushing the price lower - SMA20 dead crossed SMA50.
> A strong symmetrical resistance; upper volume profile, price resistance, and SMA200.
> This 4-wave diagonal projection is based on the unsuccessful breakout scenario with an upcoming C leg downtrend extension 0.786 - 1.0 approximately - 10 - 15% downside.
> A bullish scenario is based on the successful breakout of bull pennant and SMA200 targeting the previous 3-wave high with a +20% upside.
> Indicator: bearish MACD signal crossing below the signal and baseline
Always trade with affordable risk and respect your stoploss!
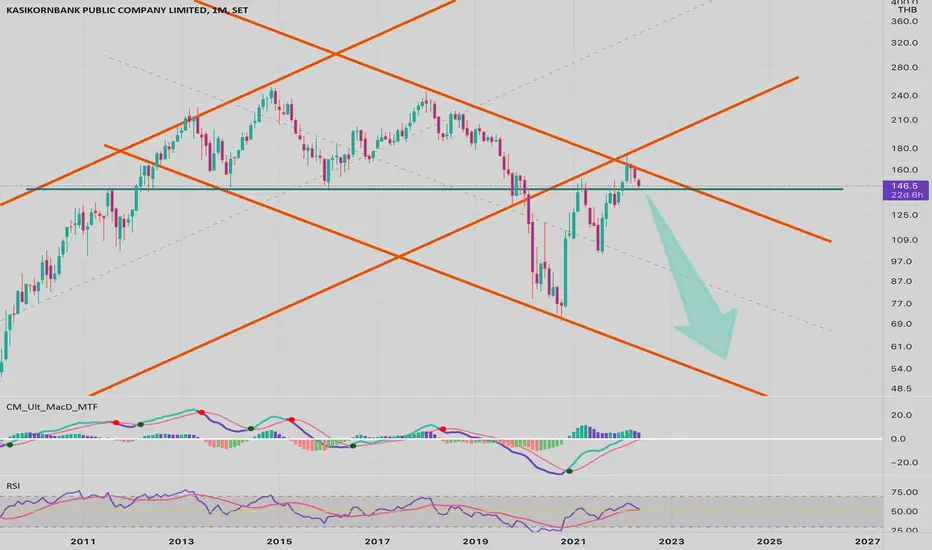
KBANK : 37$ in 2030 ? This is the main channel..in purple
Just wanna show where we actually are at this cycle
.
everything is on the chart...
its monthly chart
1 candle = 1 month
See u at bottom in some years

KBANK : Fall below this support is long term nightmareKBANK SET iNDEX
Monthly chart
.
Look like a nightmare is happening
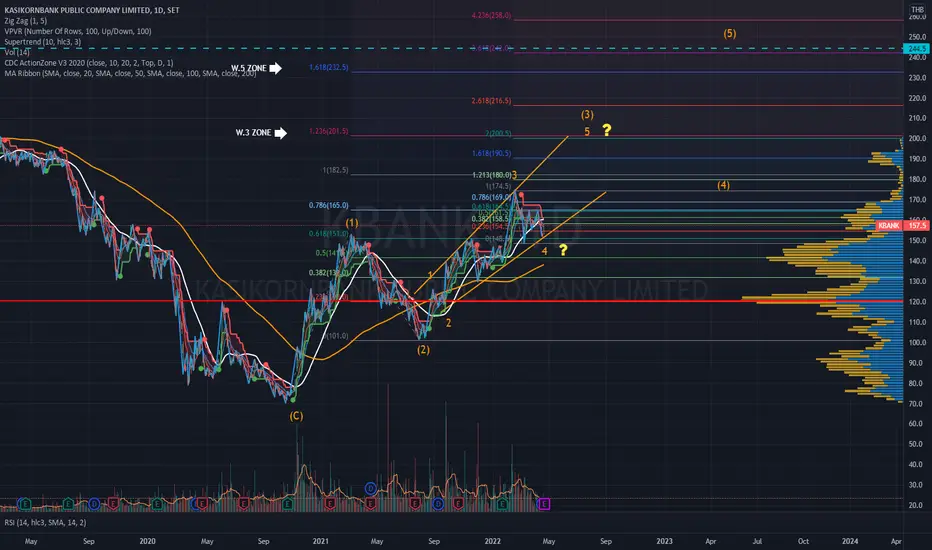
KBANK |Elliott Wave Projection - Impulse Wave 3 IntermediatePrice action and chart pattern trading - rising wedge
> Elliott Wave Projection - Impulse Wave 3 Intermediate is upcoming at 1.236 zone extension of Wave 1, assuming Wave 4 minor is here and Wave 5 minor is estimated at 1.618 - 2.0 can be impulse or diagonal.
> Entry at the pullback swing wave 4 support zone, stoploss at SMA50, RR 3:1 for medium-term trade.
Always trade with affordable risk and respect your stoploss
KBANK | Big picture | Dragon Pattern Tail Extension Target Price Action & Chart Pattern Trading
> Long term trading setup for Dragon Pattern Tail Extension Target estimated.
> Thanks to Dragon chart pattern from Nomura broker
Mr. Dragon. You can swing your tail up now!


KBANK | Bull Trap - Bearish Gartley Harmonic PatternKBANK | Thailand SET Index | Price Action & Chart Pattern Trading
> Bearish rising wedge reversal with estimated target downside for Gartley Harmonic pattern
> Enter with tight stoploss recommended
Good Luck

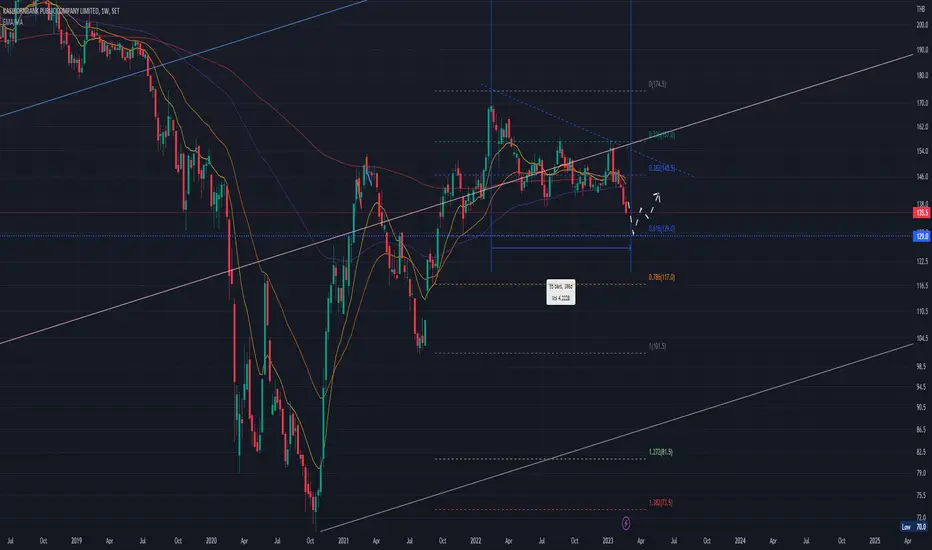
Update KBANK: Jan 8, 2022My first condition is bullish bias but the secutity price have to move and break resistance zone between 151 - 153 THB and stand on that zone with strong buyer force or large buying volume, then this security can hike up to target price around 180 THB. In another way, the price cannot break the resistance zone and stand on that zone then security price will drop to at least 123 THB.

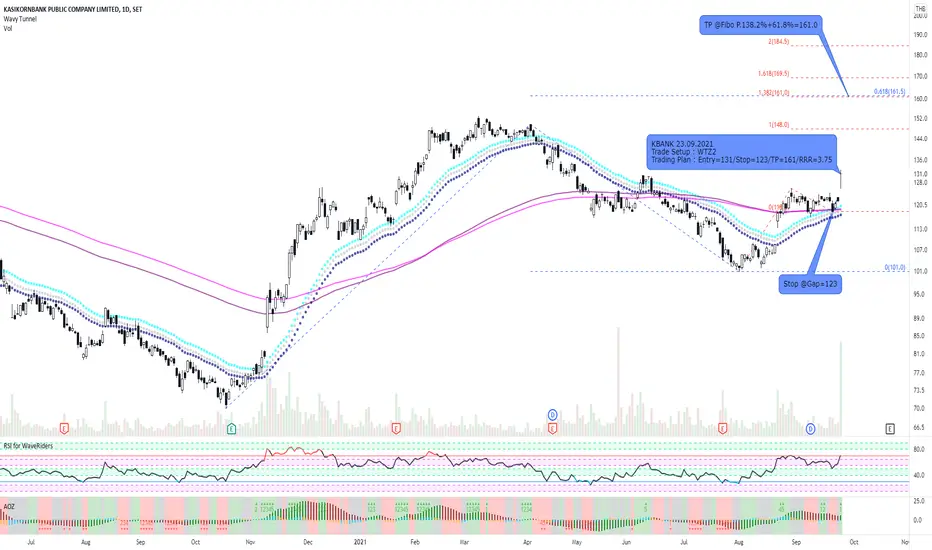
KBANK and WTZ2 trade setupKBANK and WTZ2 trade setup. Take this opportunity but manage your own risks well. Good Luck.
Kbank H4 current price 118.50Kbank H4 current price 118.50
+1. Price can stand on ema 50/100/200
-1. Price breaks short-term support ema20
-2. There is a lot of sales force coming out in 4 hours.
last before the market close
Strategy (Buy on Dip)
Buy - wait, the price may drop to test the support area.
around 116 baht if able to stand and have a large trading volume
but if unable to stand, the next support line is 113.50

Kbank Day 118.50 baht [4/9/2021] Kbank Day 118.50 baht
+1. Price can close above POC 120
+2. Price can close above EMA 200 area 118
----------
-1. Divergence RSI and Sto are born.
The price may be reduced in the area of 118.50-120.00 baht.
before rising again, target 133/150, respectively.
--------
Buy On Dip Strategy


KBANK and WTZ2 in DowntrendKBANK and WTZ2 in Downtrend. Consider risk reward ratio and position sizing before trading.


KBANK (THAILAND) - ELONGATED FLAT MIN. TARGET- The minimum target of an elongated flat is 61.8% of intermediate w(c) @P: 177


Bullish Divergence on KBANKOn timeframe Week, Bullish Divergence shows on graph.
It is a good sign for monitoring the price.
Let see what's going on KBANK.
