TMUS T Mobile Short IdeaTMUS - the street liked recent ER with a nice pop up to 122 zone resistance. So far unable to break higher however still holding.
With the gap below, I'm speculating on a move to the down side, retest trendline / close gap before seeing more upside.
Will be watching this week if price holds or continues up I will close my short at a loss.
At the very least I'm expecting some retracement after such a move up on relatively weak name.
A break above 122 will flip and go long, as trend will now be up on the shorter term daily look.
TM5 trade ideas

T-Mobile earnings popT-Mobile US (TMUS) reported Q4 December 2021 earnings of $0.34 per share on revenue of $20.8 billion. The consensus earnings estimate was $0.18 per share on revenue of $21.1 billion. I'm not really sure why Wallstreet prefers TMUS price to earnings 44.8 with a .53 debt to assets ratio over other tickers with way better valuation, but the market does what it does. lol. I'm looking for a short TMUS entry actually. Here's the TMUS 4-hour chart.
Q4 Consensus:
EPS = $0.18
Revenue = $21.1B
Fundamentals:
P/E = 44.8
EPS = $0.34
Revenue = $20.8B
Cash = $6.63B
D/A = .53
Div /Yld = ---
52 week high = $150.20
52 week low = $101.51
SMA200 = $117.27
SMA150 = $114.60
SMA100 = $112.74
SMA50 = $109.73
Do your own due diligence, your risk is 100% your responsibility. This is for educational and entertainment purposes only. You win some or you learn some. Consider being charitable with some of your profit to help humankind. Good luck and happy trading friends...
*3x lucky 7s of trading*
7pt Trading compass:
Price action, entry/exit
Volume average/direction
Trend, patterns, momentum
Newsworthy current events
Revenue
Earnings
Balance sheet
7 Common mistakes:
+5% portfolio trades, capital risk management
Beware of analyst's motives
Emotions & Opinions
FOMO : bad timing, the market is ruthless, be shrewd
Lack of planning & discipline
Forgetting restraint
Obdurate repetitive errors, no adaptation
7 Important tools:
Trading View app!, Brokerage UI
Accurate indicators & settings
Wide screen monitor/s
Trading log (pencil & graph paper)
Big, organized desk
Reading books, playing chess
Sorted watch-list
Checkout my indicators:
Fibonacci VIP - volume
Fibonacci MA7 - price
pi RSI - trend momentum
TTC - trend channel
AlertiT - notification
tickerTracker - MFI Oscillator
www.tradingview.com


TMUS Morning outlook for this weeks price actionMomentum is building up on TMUS, It's looking like a nice support level may be in place. Watch the volume levels build up.

TMUS bounce looks like they have put in a base for TMUS for now. i ike this bullish candle on the daily for TMUS as well as an unusual amount of orders coming into the stock in the last 3 days. i am looking for a bounce to atleast the 38 but this pattern has room att the way up to the 786. maybe TMUS makes a pre earnings run for a nice earning short.
NOT FINANCIAL ADVICE

TMUS Looks like it's finding support TMUS seems to be finding support and building momentum to the upside.

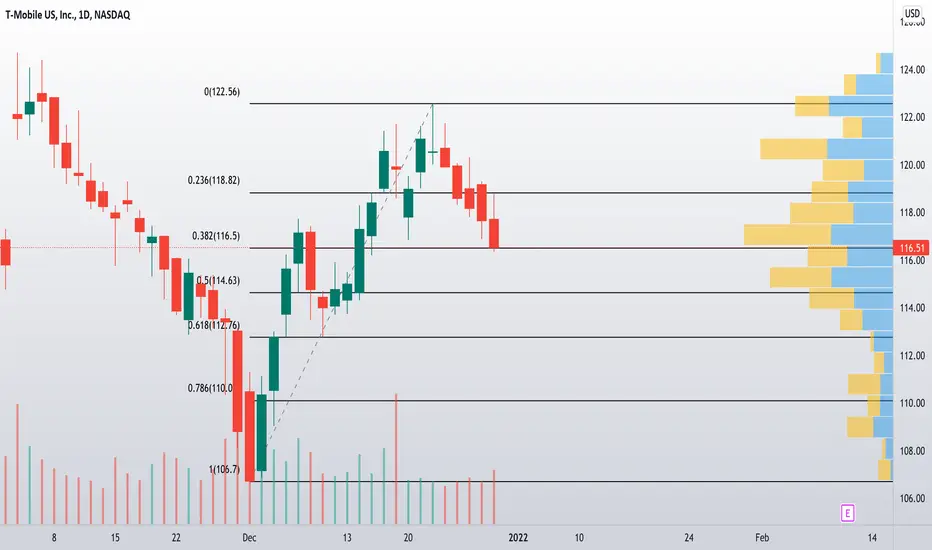
$TMUS Daily RetracementLet's see if we get a .382 bounce or if they take it down to the .618 , in which case I'd be loading.
I'm Bullish and like the technicals on the longer time frame and have posted charts , however if you're day trading and/or like Fibonacci levels, beautiful price action here.
Let's see how they close the year!
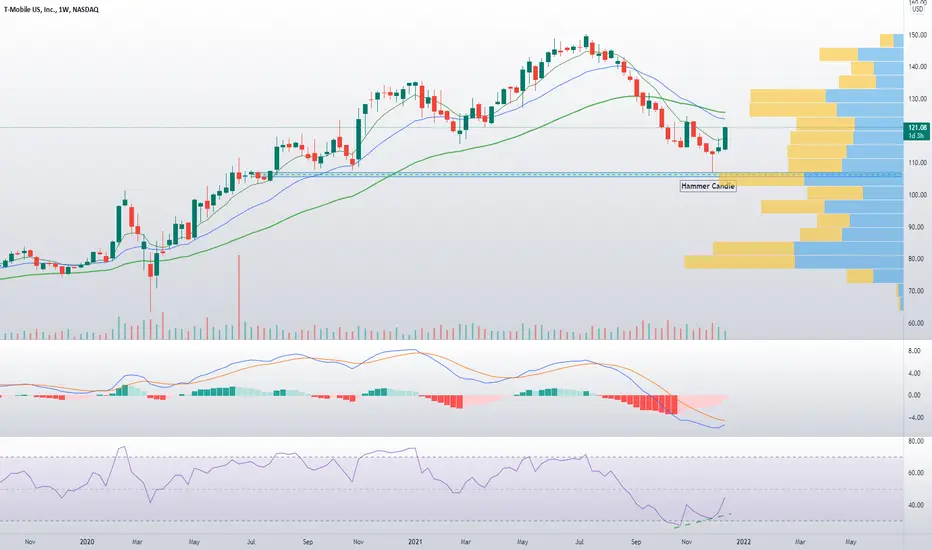
$TMUS WeeklyStill holding JAN 21 $120 calls on TMUS
MACD cross and holding nicely after a solid bounce at support (hammer candle)
I'm looking for a move to $123.5 and a rally similar to first week in NOV' 20
A break below $114 I'll exit the trade at a loss.
Worth having on your radar, as I believe this may be a pivot point and the start of an uptrend.

TMUSalready wait for the breakdown and the level test. In general, divergences are beginning to work out.

TMUS - Support strong...…downward trend reversal?T-Mobile has found support @ 106.70. 20 EMA is approaching the 50 EMA. There is relative strength since Dec 6th above 50.

$TMUS Weekly updated T Mobile swing trade working, JAN 120calls up 18% now . Should have loaded more after hammer candle but had plenty of risk on already.
Momo turning with weekly MACD ready to cross (bullish confluence).
Want to see continuation and EMAs to cross, also need to chew through overhead $124 supply. If this holds will expect another leg up. Been anticipating a "NKE like" move since NOV.
Good ER and plenty of tutes buying thinking Q4 - Q1 2022 ripper.
$124 first PT then see how price action is at that level.
Trade remains valid so long as higher lows are put in.
TMUS Weekly Options PlayDescription
TMUS began its bear market following the major trendline break in August. It has now broken through major support at 108.5 established SEP - OCT of 20'.
The break through 108.5 is the signal for the entry, and also the stop loss for the position.
Using long puts to leave the downside open.
The level of the VIX right now is my primary concern in opening long option positions. I consider all of my positions risky, and manage risk accordingly.
Long Put
Levels on Chart
SL > 108.5
PT : 92
*Stops based off underlying stock price, not mark to market loss
The Trade
BUY
12/31 100P
R/R & Breakevens vary on fill.
Manage Risk
Only invest what you are willing to lose

$TMUS with a Bullish outlook following its earnings #Stocks The PEAD projected a Bullish outlook for $TMUS after a Positive over reaction following its earnings release placing the stock in drift B with an expected accuracy of 100%.
If you would like to see the Drift for another stock please message us. Also click on the Like Button if this was useful and follow us or join us.


Tmus looks sold off Looking for just a plain ole gap fill on t mobile, trading seems boring right now so i think ill pick a boring stock.

$TMUS Weekly Pivot Point to be confirmed (or rejected) this weekGreat ER pop as T-Mobile was entering strong demand zone.
What a coincidence :)
See if we get a confirmed pivot point this week... possible some retracement, but MACD and Williams %R indicators showing bullish confluence of a pivot point here.
Closed DEC calls up nicely, still holding JAN $120c up +66%. Stop loss just above break even.
With confirmation I think near term we see a move to $130 zone resistance, and then ATH , similar to the recent NKE move (sold my calls too soon wow Nike ! )

QuickTradeThe daily EMA may act as resistance, but the cross can't be hided.
Looking for a PEG follow through
Stop at 118.20 / 120.20

$TMUS WeeklyLooks like a good entry for a long here as an idea on TMUS weekly. Over sold, at a good support zone, with 150EMA below for stop loss target.
ER this week wouldn't be surprised if it sparks a pivot point here to at least get a bounce similar to Nike's (NKE) recent price action.
I'm in DEC and JAN $120C
Price target at least $130 for a head and shoulders pattern/relief bounce , or extreme bull case - continuation of the longer term uptrend to all time highs.
Tmobile post earnings Severely oversold on the weekly RSI and MFI.
breaking out from under wedge (Whiteline) and forming a double bottom that I think could carry TMUS back to 129. But first it needs to crack 123.30 fib resistance


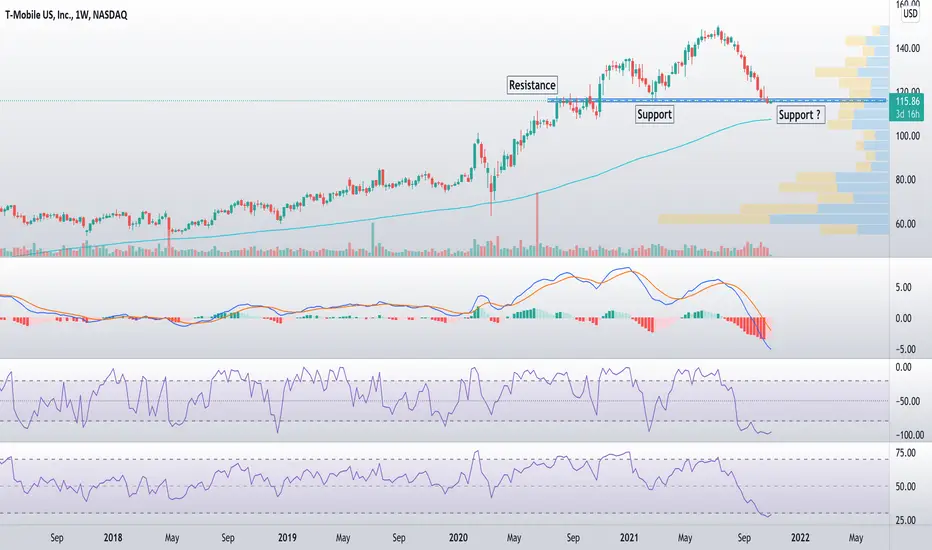
TMUS - wekly chartWeekly analysis, meaning that this analysis concerns the medium-term investor
Important weekly support at 115.89, if prices close below it as a weekly close, the cup and handle pattern is confirmed
The target becomes 81.50, with a drop of 30.00%.
Stop losses if it closes weekly above 122.66, with a loss of 5.75%

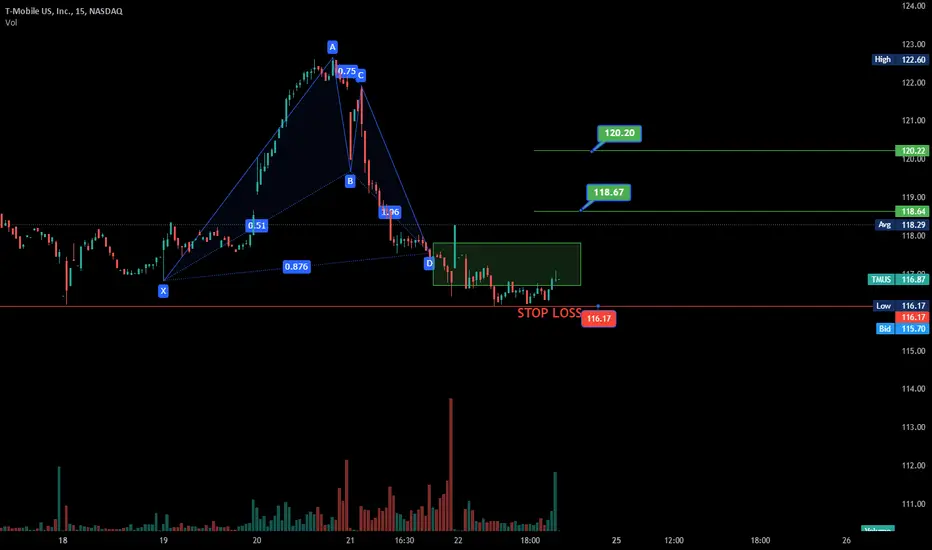
TMUS READY TO RUN PT1 118 PT2 120NASDAQ:TMUS
TMUS READY TO RUN PT1 118 PT2 120. No more then next week we may see it run very close to stop loss.