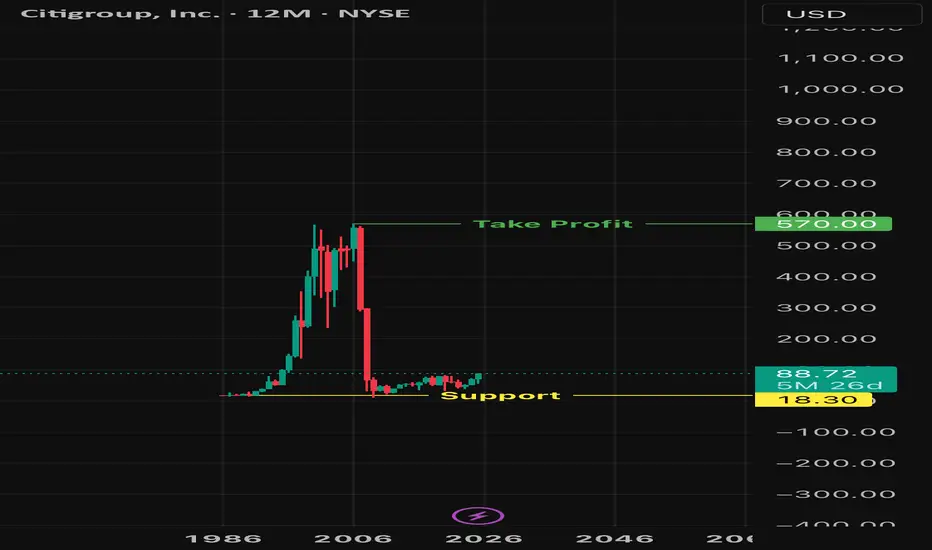
Is Citigroup (C) the Most Undervalued Big Bank Right Now?🔥Let’s talk numbers:
🧮 P/E: 9.78x
💸 P/S: 0.66x
That’s deep value — Wall Street’s sleeping on this one. While everyone's chasing AI, Citigroup is trading at garage sale prices.
🧠 The Setup:
If you're into swing plays with strong R/R and macro upside, C is worth a look.
🔑 Entry Zones: 1️⃣ Market price — for early bulls
2️⃣ $55 — breakout confirmation
3️⃣ $48 — bargain bin steal
🎯 Targets:
TP1: $70 🟢
TP2: $78 🚀
TP3: $84 💰
💬 Why it matters:
Citi has been lagging behind peers like JPM, but it’s still a beast. If the Fed holds or cuts, banks could catch a serious bid — and this one’s ready to pop from a value base.
📌 Watching volume at $55 and any macro shifts as catalysts.
👀 Don’t ignore this one just because it’s not trending. That’s where smart money hides.
📢 Disclaimer:
This is not financial advice. Just sharing ideas and setups I’m watching. Always do your own research and manage your risk.
#Citigroup #C #Undervalu
#Citigroup #C #UndervaluedStocks #SwingTrade #TradingSetup #DeepValue #Banking #PEratio #SmartMoneyMoves #StockMarket #Financials #Watchlist
TRVC trade ideas

Citigroup Citigroup looks like a great buying opportunity. A seemingly double bottom has formed so I expect a bullish trend to the all time high and perhaps, eventually beyond.
Citigroup Wave Analysis – 2 July 2025
- Citigroup broke key resistance level 85.00
- Likely to rise to resistance level 90.00
Citigroup recently broke above the key resistance level 85.00 (former multi-month high from February, which stopped the previous wave (A), as can be seen below).
The breakout of the resistance level 85.00 accelerated the active minor impulse wave 5 of the intermediate impulse wave (C) from April.
Citigroup can be expected to rise further to the next resistance level 90.00 (intersecting with the daily up channel from April).

Watching for Pullback Below $84 in Citigroup (C)Over the past month, Citigroup shares have appreciated 8.58%, outperforming both the Finance sector's 1.91% gain and the S&P 500's 3.92% increase. This relative outperformance may signal strength, but short-term positioning and market structure suggest a potential shift.
Expecting a Sharp Move Below $84 – Option Flow Insight
Despite the recent strength, I anticipate a significant downward move below the $84 level in the upcoming week. This expectation is based on notable option activity detected in the Times & Sales feed, specifically large put orders suggesting bearish positioning.
In response to this setup, I plan to execute a bearish vertical spread, specifically:
Buying the $84 puts
Selling the $80 puts
This strategy limits downside risk while still profiting from a potential retracement.
Fundamental Picture Ahead of Earnings
Citigroup's next earnings release is scheduled for July 15, 2025. The company is expected to report:
EPS of $1.70 (+11.84% YoY)
Revenue of $20.85B (+3.51% YoY)
For the full year, the Zacks Consensus Estimate forecasts:
EPS of $7.38 (+24.03%)
Revenue of $83.84B (+3.33%)
While these figures suggest healthy growth, it's important to note that recent analyst estimate revisions have been modestly negative, with the EPS estimate decreasing 0.27% over the last 30 days. Citigroup currently holds a Zacks Rank #3 (Hold), reflecting a neutral sentiment from analysts.
Valuation Metrics
From a valuation standpoint:
Forward P/E: 10.75, notably below the industry average of 15.02
PEG ratio: 0.61, versus the industry average of 1.26
This indicates that Citigroup is undervalued relative to its peers, especially when considering growth prospects, which could provide some support. However, short-term bearish flows may dominate price action heading into earnings.
Industry Outlook
The Financial - Investment Bank industry, which includes Citigroup, currently has a Zacks Industry Rank of 96, placing it in the top 40% of over 250 industry groups. Historically, industries in the top half outperform those in the bottom half by a factor of 2 to 1.

Citigroup Wave Analysis – 25 June 2025- Citigroup rose above the resistance level 78.60
- Likely to rise to resistance level 84.65
Citigroup recently rose above the resistance level 78.60, which stopped the previous minor impulse wave 3 at the start of June.
The breakout of the resistance level 78.60 accelerated the active short-term impulse wave 5, which belongs to the sharp intermediate impulse sequence (C) from the start of April.
Citigroup can be expected to rise to the next resistance level 84.65, former multi-month high from February.

Citi Bank into heavy resistance.As you can see Citi broke down from this rising wedge last week and is now testing the under belly as resistance, which also coincides with the .786 fib retracement on the weekly timeframe. A close above the .786 on a weekly basis would cancel the bearish view, otherwise the path of least resistance is to the downside.

This is a gift for any new trader..A while ago I was trying to strengthen my Top down game.
So I setup a b/tp/sl for down the road. Completely forgot about it. Just checked it today and it hit.
It took time.
I did it around march setting a long position.
So for anyone out there that thinks they are terrible at trading and are losing constantly.
Well this is a hard business.
My family say they support me. Under their breath "Go get a job!"
This is my job.
My family always was a "If only we had invested in ( TPEX:IX0043 or #property) when it was cheaper.
I said F' that. Im going to be a "I had invested in it."
But still profit. Seriously if you understand top down MMA Ground and Pound. You can figure it out and WIN!!!!!
Tacos rock.

Citigroup: Bullish Momentum Signals Upside PotentialCurrent Price: $76.36
Direction: LONG
Targets:
- T1 = $78.65
- T2 = $80.00
Stop Levels:
- S1 = $75.00
- S2 = $73.75
**Wisdom of Professional Traders:**
This analysis synthesizes insights from thousands of professional traders and market experts, leveraging collective intelligence to identify high-probability trade setups. The wisdom of crowds principle suggests that aggregated market perspectives from experienced professionals often outperform individual forecasts, reducing cognitive biases and highlighting consensus opportunities in Citigroup.
**Key Insights:**
Citigroup's fundamentals, coupled with recent bullish sentiment in the broader financial sector, position it favorably for upside potential. Positive market conditions, alongside robust earnings forecasts for the upcoming quarters, drive investor confidence. Additionally, moderate volatility provides an attractive entry window for bullish positions targeting higher price levels. Citigroup's financial stability and steady dividend payouts further strengthen its appeal as a long-term portfolio asset.
**Recent Performance:**
Over recent weeks, Citigroup's stock has demonstrated resilience, marking steady gains amid broader market fluctuations. Supported by improving loan growth and banking activities, monthly performance indicators align with sector-wide growth. Minor pullbacks have been limited, emphasizing its upward trajectory and ability to retain investor interest in varied market conditions.
**Expert Analysis:**
Analysts remain optimistic about Citigroup's outlook, highlighting effective cost management, strong quarterly earnings, and favorable future guidance. Its dividend payouts ensure consistent income for shareholders, which contributes to its perceived stability as an investment option. Although potential regulatory challenges and economic headwinds exist, the bank's proactive strategies mitigate these risks effectively, keeping sentiment largely positive for the midterm.
**News Impact:**
Recent updates include significant advancements in Citigroup's digital banking infrastructure and technology-driven initiatives aimed at enhancing customer experience. Partnerships and streamlined operations bolster confidence in the firm's ability to sustain growth and adapt effectively to the evolving landscape of global finance. Such developments add to the stock's appeal and affirm the bank's commitment to long-term success.
**Trading Recommendation:**
Taking a long position in Citigroup at the current price of $76.36 seems promising, given the favorable technical and fundamental indicators. Target levels $78.65 and $80.00 represent key profit zones, while stop levels at $75.00 and $73.75 ensure prudent risk management. With its consistent performance and bullish outlook, Citigroup remains highly attractive for traders seeking mid-term growth opportunities.

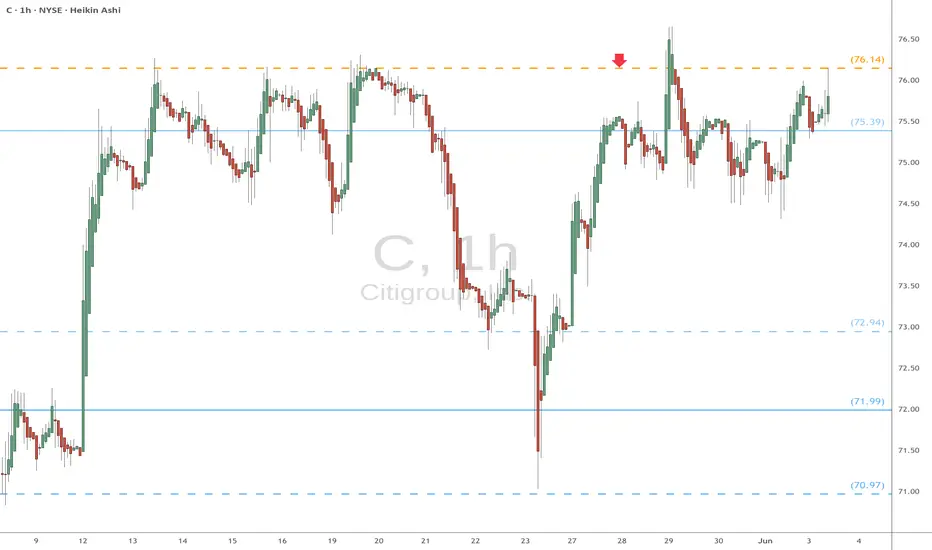
C (Citi) eyes on $76.14: Golden Covid ready to launch BreakOutC with all banks has recovered to pre-tariff levels.
It has pierced a proven Golden Covid fib at $76.14
Look for a Retest (preferably with a Ping) for entry.
City Group this weeks best choice from the earnings calendar!Hi guys we would take a look into our perspective for Citygroup, which out of this weeks earnings stocks gives us the best potential, we are targeting a whoping 20% increase for our end goal.
Citigroup (NYSE: C) is demonstrating strong growth potential in 2025, driven by robust earnings, strategic initiatives, and favorable market conditions. Here's our comprehensive analysis focusing on Citigroup's growth prospects:
📈 Recent Performance Highlights
Q1 2025 Earnings: Citigroup reported a 21% year-over-year increase in net income, reaching $4.1 billion ($1.96 per share), surpassing analyst expectations of $1.85 per share. Revenue rose 3% to $21.6 billion, exceeding forecasts. The growth was primarily driven by a 23% surge in stock trading revenues amid market volatility and increased client activity.
Return on Tangible Common Equity (RoTCE): The bank's RoTCE improved to 9.1%, nearing its target range of 10–11%, indicating enhanced profitability and efficient capital utilization.
📊 Growth Metrics & Analyst Outlook
Earnings Per Share (EPS) Growth: Analysts project a 15.3% annual EPS growth for Citigroup over the next five years, outpacing peers like Bank of America (9.0%) and JPMorgan Chase (3.9%).
Revenue and Earnings Growth: Citigroup is forecasted to achieve a 9.8% annual earnings growth and a 7.9% revenue growth over the next three years.
Share Repurchase Program: The bank has initiated a $20 billion share buyback program, reflecting confidence in its financial strength and commitment to returning capital to shareholders.
🚀 Strategic Initiatives & Market Position
Operational Efficiency: Citigroup is investing in technology and streamlining operations, including reducing reliance on external IT contractors and enhancing data management systems. These efforts aim to improve efficiency and regulatory compliance.
Market Leadership: The bank's diversified business model, encompassing trading, wealth management, and banking services, positions it well to capitalize on various market opportunities.
⚠️ Market Considerations
Economic Uncertainty: While Citigroup's performance is strong, broader economic uncertainties, including potential recessions and regulatory changes, could impact future growth. Analysts are monitoring these factors closely.
✅ Our Conclusion
Citigroup's robust earnings growth, strategic initiatives, and strong market position make it a compelling candidate for investors seeking growth opportunities in the financial sector. The bank's focus on operational efficiency and capital return strategies further enhances its growth prospects!
The entry would go as following -
Entry point : 63.80
Target 1 : 71.69 - just above the GAP which was previously formulated, when we pass it this would cement our uptrend formation.
Target 2 : 75.30 - finalizing almost 20% growth of the stock which would be around the strong resistance area.
Stop Loss : 55.50 - around the bottom zone , which there was a lot of volume supported by the buyers.

City Group LongC is now net long on the regression break.
I am reviewing all options on the market after these moves.


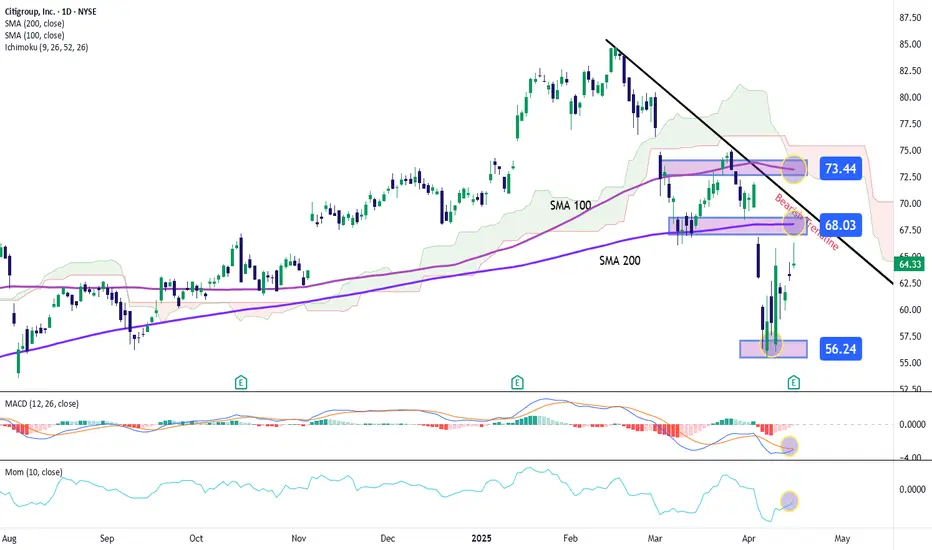
Citigroup Stock Nears Key Level After EarningsCitigroup’s stock has gained over 2% in the last trading session, as its latest earnings results have supported a moderately bullish bias on the current price chart. The company reported earnings per share (EPS) of $1.96, beating the expected $1.85, while revenue reached $21.6 billion, exceeding the forecast of $21.29 billion. These positive figures triggered a bullish price gap, which is currently sustaining steady upward pressure on the stock.
Downtrend in Focus
Despite the recent upward movement, the chart continues to show a consistent downtrend that has been in place since February 18. Although buying momentum has increased in recent sessions, the price remains within the broader bearish trend, which still dominates in the short term. For now, this trendline continues to be the most relevant technical structure to watch.
MACD
For the first time in nearly 10 sessions, the MACD histogram has returned to the zero line after a prolonged period in negative territory. This may indicate a strengthening bullish momentum. Additionally, both the MACD line and the signal line are showing signs of a bullish crossover, further highlighting potential short-term buying interest. If these technical conditions persist, buying pressure may become increasingly relevant.
Momentum
The momentum indicator over the last 10 sessions has maintained a steady upward slope, gradually approaching the neutral zero line. This reinforces the outlook for a renewed buying push in the price action.
Both technical indicators are currently signaling a slight increase in bullish momentum. However, the price still needs to challenge the 200-period moving average — a key resistance level — to confirm a clearer short-term direction.
Key Levels:
$56 – Key Support: This level represents the recent weekly lows. A move down to this area could strengthen the prevailing downtrend.
$68 – Near Resistance: Aligned with the 200-period moving average, a breakout above this level could challenge the current downtrend and confirm renewed bullish strength in the short term.
$73 – Distant Resistance: This level aligns with the 100-period moving average. Price action approaching this area could confirm the emergence of a new upward trend.
Written by Julian Pineda, CFA – Market Analyst
C - $42 incomingHeading back to the low on the long-term trendline, as this stock has done so many times before. I've got my GTC order set to $42

C BACK TO 75NYSE:C has full-time frame continuity going to the downside, but we are preparing to go into another quarter, month, and week starting Monday. We just had a pullback and on the 4h chart, price action is sitting in the golden fibs zone (61.8). The risk/reward ratio is 6:1.
Could swing with a April monthly contract.

City Group LongC long on the regression break.
There are many USA stock turning and I am considering my option on this pair.

Missed this by a few daysThey say hindsight is 20/20.
I was reviewing some stocks I follow today. Saw here where C has pulled back to the long-trend DMA,and that just happened to coincide with the Fibbo gold bar retracement and the trend line from earlier that it has touched a couple of times. An approximate 3-day consolidation and it is off to the upside again.
Here is where I could use some help. When a stock bounces off the Fibbo like this, where does it run to next? If you were looking to figure out where C runs up to before its next top/consolidation, where do you see that and why? TIA

CORN Futures Net-ShortCorn is net-short on the regression break
There is a negative roll of (-2.8%) on this pair.
I am considering to enter for a short peroid.

Citigroup Inc Stock Quote | Chart & Forecast SummaryKey Indicators On Trade Set Up In General
1. Push Set Up
2. Range Set up
3. Break & Retest Set Up
Notes On Session
# Citigroup Inc Stock Quote
- Double Formation
* (Uptrend Argument)) | Completed Survey
* ABC Flat & Entry Feature | Subdivision 1
- Triple Formation
* 1st Retracement | Retest Area & Uptrend Bias | Subdivision 2
* 2nd Retracement | Long Support | Subdivision 3
* Daily Time Frame | Trend Settings Condition
Active Sessions On Relevant Range & Elemented Probabilities;
European Session(Upwards) - US-Session(Downwards) - Asian Session(Ranging)
Conclusion | Trade Plan Execution & Risk Management On Demand;
Overall Consensus | Buy

Citibank Wave Analysis – 3 February 2025
- Citibank reversed from support level 76.00
- Likely to rise to resistance level 82.00
Citibank recently reversed up from the support level 76.00, intersecting with the 20-day moving average, 50% Fibonacci correction of the upward impulse from January.
The support zone near the support level 76.00 was further strengthened by the upper trendline of the recently broken up channel from August.
Given the clear uptrend, Citibank can be expected to rise to the next resistance level 82.00 (which stopped the previous sharp impulse wave 3).

Speculative Madness: The Market’s Bubble Stocks Some stocks areSpeculative Madness: The Market’s Bubble Stocks
Some stocks aren't just overvalued—they're in full speculative bubble mode. Fundamentals? Irrelevant. When euphoria takes over, rationality disappears.
Here’s my list of bubble stocks that scream unsustainable pricing:
SBUX, T, PLTR, BMY, PYPL, NFLX, GS, ISRG, ARM, C, SHOP, BSX, SPOT, UBS, IBKR, RELX, CEG, CRWD, MSTR, MMM, DASH, COF...
And let’s not forget the obvious: TSLA, META, AMZN, AVGO, GOOGL, JPM, MA, V, WMT.
Honestly, the entire banking sector, brokers, and tech are in bubble territory.
What the hell is going on with this market? Why are algos just buying, buying, buying, squeezing all the shorts?! Unbelievable.
The dump will be insannnnnnnne!!! 🚨

$C Tradespoon - Long Entry $81.98Tradespoon model generated long signal for Citigroup NYSE:C with 70% probability to stay above $81.98 today. Predicted range: $81.98–$84.74. Estimated change: +1.46%. NYSE:C

Short in Full Effect... 15 month Bull Run approaches resistanceWhat I see from this monthly layout of Citigroup NYSE:C is a sustained 16 year uptrend that is approaching a quadruple top in its' current 15 month Bull Run. The resistance sits at 83.11 and could be heading back to the previous month high of 73.38.
My interest in options, at the moment, are as follows...
1/31-81 Put at .64
2/28-77 Put at .65
3/21-77.5 Put at 1.26, 75 Put at .74, 72.5 Put at .44, and 70 Put at .28
As a Libra, I tend to see both sides in a few different aspects of life and investing is no different. Some investors make decisions that are biased, others are emotionally attached to their choices or a particular stock, or they may be uneducated about trends and technical analysis. However, most seasoned investors know you can make money by both shorting or longing a stock. So with that being said, keep an eye out for a break and close above 83.11. If that happens, there are clear skies above dating back to 2008.
Call Options I would consider at that point would be as follows...
1/31-83 Call at .35
2/28-87 Call at .42
3/21-87.5 Call at .84, 90 Call at .50, and 95 Call at .21
I look forward to checking back in with you all this week. Again, this is not financial advice nor am I a stock guru selling you hopes and dreams. I highly recommend you dive into your own due diligence before you make a decision based off mine or someone else's opinion. As always, take profits, take profits, take profits!!! I cannot stress that enough, as I myself have held onto positions longer than I should have and lost out on profits gained. Enjoy your week trading ladies and gents!
