XOM BUY BUY BUY Hey everyone!
This one here is a great buy buy the pull backs and hold until 2023 and thank me then.
All my indicators show strong strong buy!
This is where everyone one should invest in not gold OIL we use so much of it daily. And cost have gone down in the past years where gonna see it take over OIL industry is back and stronger then ever.
XONA trade ideas

XOM - Re-Testing the L-MLHXOM is super strong.
I use my favorite tool, the pitchfork, to apply projections of price, filtering, find entries, exits etc.
What many pitchfork traders don't understand is, that they can't just apply this tool to the chart. I see many doing it wrong anyways, which has to do with identifying the correct pivot/swing/pendulum swing points, and not being aware of the rules.
However, using the rules is equally important. Because the rules define the framing around this tool. Otherwise it's worth nothing, or even harmful to the trader.
One of the rules says, that if price is trading outside the pitchfork, it often is going to test/re-test the line where it fell/zoomed out of.
In this case it's the L-MLH, the Lower-Medianline-Parallel. As we see, the first test was just a couple days ago. Now, it looks like XOM is re-testing the L-MLH again.
What happens after the re-test?
a) price is either strong enough to trade back into the projected pitchfork again, recapturing the previous slope/path of price.
or
b) price will trade to the next WL (Warning Line), going south or eating up time by trading sideways.
As a firm believer in the rules of the pitchfork, I'm long this stock, playing for a re-test at the L-MLH.


Long XOM - Retesting it's breakout level
Just an idea, but has sub 15 p/e and should be extra profitable this year..

XOM bear call vertical for 4/8XOM seems to be having a hard time getting going bullish, so I'd look for continued downside. Not hugely bearish but doesn't seem like it wasn't to go to the upside; for now. Snagging a bear call vertical for 4/8 at 82/85.

XOM bullishI have been showing many positions with bearish direction recently. This position is meant to be a hedge to many of those, and this is one of the very few I could find that look really good bullish. So going to do the Apr 1 84/86 bull call vert. I like the trade a lot but it is mostly to offset many of the shorts I have open, so I am making this position larger than normal.

XOM Bullish Setup - AB=CD pattern?As of 13 Nov 2021, 21 Jan 2021 - $62.5C:
Open Int = 19k
Volume = 6,533
Delta = 0.564
Imp vol = 29.5%
What's your thought?

XOM: Cash Me OussideXOM Weekly Bullish RJ could be a bag and a half. This can be played to the upside or to the downside. If we are playing to the downside we could be making an outside bar by the end of the month to 73.49.
**Weekly Bullish RJ Trigger**: 83.45 with targets to 84.92, 86.88, 91.51
Upside catalysts : Daily 2-2 reversal at the Monthly Retest Area; Gap fill to 80.44; Two Down Retest Area at 81.60. I'll keep an eye on for a continuation through the 2D retest area and through the Bullish RJ entry.
Downside : Look for a strat reversal pattern after the gap fill or at the 2 down retest area at 81.60. There has been a lot of selling taking place since March and we could be forming one last bear flag (gap fill or at the 2D retest areas) then sell off to make an outside bar for the month. I have been seeing higher than normal volume of selling when compared to the buying volume which could be a catalyst for more downside.
I won't believe things until a strat pattern confirms on the weekly or higher timeframe. No trigger, no trade!
If we start to see a continued run on tech stocks I could see continued profit taking on this ticker with the cash moving into tech stocks to catch the rally. If tech stocks start to sell off, I could see money moving back into this ticker.


Exxon Mobil Pulls Back from 5-Year HighExxon Mobil has pulled back following a big surge earlier this year.
XOM shot above $90 last week for the first time since early 2017. It then retraced almost all the move and is now trying to hold its 50-day simple moving average (SMA).
Its current price level is also near a high from June and July 2019. Can it turn old resistance into new support?
Third, stochastics are nearing an oversold condition.
Finally, the recent pullback may be viewed as a completed ABC correction.
Given the sharpness of its recent drop, some traders may want to see XOM stabilize further. Still, energy is the leading sector in 2022 amid rising demand and the Ukraine crisis.
This week alone, the International Energy Agency (a global organization) warned of more shortages. The Energy Information Agency (part of the U.S. government) separately predicted crude oil will remain above $100 for the next several months. Covid in China is a risk, but trend followers may look for the current trajectory to continue.
TradeStation has, for decades, advanced the trading industry, providing access to stocks, options, futures and cryptocurrencies. See our Overview for more.
Important Information
TradingView is not affiliated with TradeStation Securities Inc. or its affiliates. TradeStation Securities, Inc., TradeStation Crypto, Inc., and TradeStation Technologies, Inc. are each wholly owned subsidiaries of TradeStation Group, Inc., all operating, and providing products and services, under the TradeStation brand and trademark. When applying for, or purchasing, accounts, subscriptions, products and services, it is important that you know which company you will be dealing with. Please click here for further important information explaining what this means.
This content is for informational and educational purposes only. This is not a recommendation regarding any investment or investment strategy. Any opinions expressed herein are those of the author and do not represent the views or opinions of TradeStation or any of its affiliates.
Investing involves risks. Past performance, whether actual or indicated by historical tests of strategies, is no guarantee of future performance or success. There is a possibility that you may sustain a loss equal to or greater than your entire investment regardless of which asset class you trade (equities, options, futures, or digital assets); therefore, you should not invest or risk money that you cannot afford to lose. Before trading any asset class, first read the relevant risk disclosure statements on the Important Documents page, found here: www.tradestation.com .

EXXON MOBIL CORPORATION show very good bullish signalEXXON MOBIL CORPORATION show very good bullish signal, if we break the resistance line, there is a high probability of the continuation of the trend.

3/13/22 XOMExxon Mobil Corporation ( NYSE:XOM )
Sector: Energy Minerals (Integrated Oil)
Market Capitalization: $359.517B
Current Price: $84.92
Breakout price: $83.00 (hold above)
Buy Zone (Top/Bottom Range): $82.90-$77.15
Price Target: $85.00-$86.20 (Reached), $98.00-$100.00 (2nd)
Estimated Duration to Target: 50-52d
Contract of Interest: $XOM 6/17/22 105c
Trade price as of publish date: $1.25/contract

XOM - 1D Long Signal💡💡#SIGNAL 💡💡
$XOM
▶️ Buy NOW + Block
🔴 SLT - 1D (Trigger)
#XOM_1D_070322
Due to the conflict between Russia and Ukraine, a significant increase in oil and gas prices is expected.

XOM Buy H4 trend followingBuy when the price reach the oblique resistance or when the RSI rech the zone of neutrality.

Shorting Exxon. XOMGoals 73, 72, 70. Invalidation at 88.
We are not in the business of getting every prediction right, no one ever does and that is not the aim of the game. The Fibonacci targets are highlighted in purple with invalidation in red. Fibonacci goals, it is prudent to suggest, are nothing more than mere fractally evident and therefore statistically likely levels that the market will go to. Having said that, the market will always do what it wants and always has a mind of its own. Therefore, none of this is financial advice, so do your own research and rely only on your own analysis. Trading is a true one man sport. Good luck out there and stay safe

Exxon mobile cool off.Exxon shares are trading lower Wednesday as oil prices pull back following recent strength. Oil stocks have been gaining in recent weeks as a result of the Russia-Ukraine conflict and a resulting U.S. ban on Russian oil imports. Exxon Mobil was down 5.88% at $82.62 ahead of the close.
The stock broke above the $63 resistance and has been flying since the break above. The stock looks to have found some support near the $75 level; this area may become support again in the future and could become a long-term area if it can hold as support multiple times.
The stock trades above both the 50-day moving average and the 200-day moving average. This indicates the sentiment is turning bullish, and each of these moving averages may hold as an area of support in the future.
The Relative Strength Index has been pushing higher and now sits at 71. The RSI is in the overbought region and is showing the stock is seeing much more buying pressure than selling pressure. If the RSI can stay in this area, the stock may continue to push higher.
Exxon Mobil is seeing a strong period of bullish momentum as oil prices have pushed higher. This strong bullish push is likely going to see a period of consolidation for a time before the price pops again.
Bullish traders want to see the stock fall back to support before possibly entering.
Bearish traders are looking for a break below the support to see a possible move down toward the next area of support near $63.

BACKTESTING XOM AND USOBACKTESTING XOM for Tweezer Top candle stick formation and profitable entry and exit strategies
XOM MARCH 8TH
TWEEZER TOP FORMATION
ENTRY CANDLESTICK WAS AT 2PM
USO MARCH 8TH TWEEZER TOP FORMATION
ENTRY CANDLESTICK WAS NOON

XOM | LONG| Long-termXOM is making Higher Highs and Higher Lows. It will move from there making new Higher Highs and Higher Lows

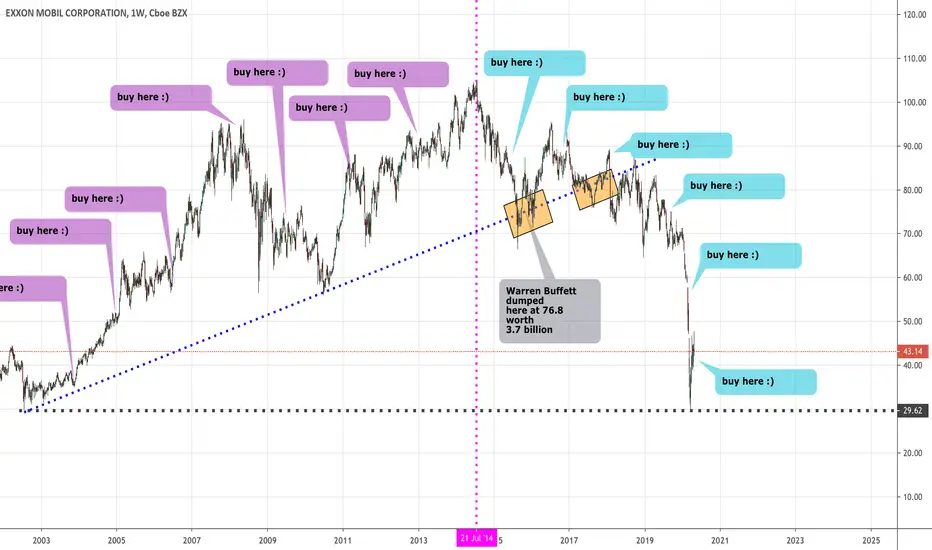
Is DCA method fool proof ?I am frustrated when I read comments on social media when Financial Agents are saying to do Dollar Cost Averaging to their clients and not to time the market.
I picked this stock, XOM which was Warren Buffett's favourite stock once upon a time. Had you done your DCA method from Jul 2002 to Jul 2014, a period of 12 years, you would have made a tidy profits of 243% (average of 20% per year which beats S&P500)
On the contrary, had you been advised by a FA or listened to the crowd without doing any due diligence, your portfolio is definitely going belly under. Coincidentally, you are buying at the peak of XOM and buying more when it begins to slide further. Your loss would be around 71% if you continue to hold to current period.
So you see, my friend, do take others advice with a pinch of salt. As I have said umpteen times, nobody should manage your money better than you. You and only you are responsible for your money.
Over the last 6 years, not only had you lost your capital, incur a huge loss but more importantly, had lost a great opportunity to compound your capital for a higher returns. To compensate this loss, you will need to do the following
1. cut partial loss, transfer part of capital to better deployment
2. wait for XOM to recover to your purchase price, stop all DCA
3. increase your capital deployment to other assets to make up for the loss
By learning to draw simple trend line (blue dotted line), one can see there were several failed breakdown (mark in orange) before it eventually break down in 2018.
If you have not learn to short sell, by looking at the chart, you would know to avoid buying this stock and move on to better opportunities. Such is the simplicity and power of using trend lines.
XOM Great Company Bad Chart - Short With Cheap Leap PutsTitle says it all this great company will be be back at $60 or below then when prices adjust to an eventual $35. Do your own DD Not advice

Buffett's tactics
Patience! Patience!! Don't run. See how big the bags under my eyes are?
The sparrow tactics
The bird asked her mother, "How do I do if I don't have enough to eat?" A few more flights,
Ten back and forth, you can eat more than 20 grains of millet, which is called many a mickle makes a mickle!
Leading tactics
Haven't you heard the big boys in the gang call them Alpha Dragon? Follow the dragon if you want!!
Bottom tactics
Xiao Ming invested in the house, thinking that he would make two sets in a short time.
10 years less struggle!! Clever!
Analyst tactics
Stop chasing! You're about to fall!
True love life, away from blind bottom fishing!
Dozen face again, if early buy can earn how much money??

$XOM with a Bullish outlook following its earnings #Stocks The PEAD projected a Bullish outlook for $XOM after a Positive Under reaction following its earnings release placing the stock in drift A with an expected accuracy of 80%.

XOM coming in hot!$XOM coming in as a hot commodity right now, with the possibility of banning Russian oil in the US and other allied countries.
left the other oil producers to be on the hot list for possible back up producer to counter the banning. for the people who doesn't know,
Russia is the 3rd largest oil and natural gas producer in the world. with the banning being imposed, this will take a toll on most countries
who relied on Russian oil and gas making a possible world wide shortage of oil and natural gas if the other oil producer can't keep up.
Day trade or scalp target play: 03/ 08 /22
Buy call above 85.06 sell at 86.36
Buy puts below 83.67 sell at 81.74
Hello everyone,
welcome to this free technical analysis . ( mostly momentum play )
I am going to explain where I think this stock is going to go over the next day or week play and where I would look for trading opportunities
for day trades or scalp play.
If you have any questions or suggestions which stock I should analyze, please leave a comment below.
If you enjoyed this analysis, I would definitely appreciate it, if you smash that LIKE button and maybe consider following my channel.
Thank you for stopping by and stay tune for more.
My technical analysis is not to be regarded as investment advice. but for general informational proposes only.
