XONA trade ideas

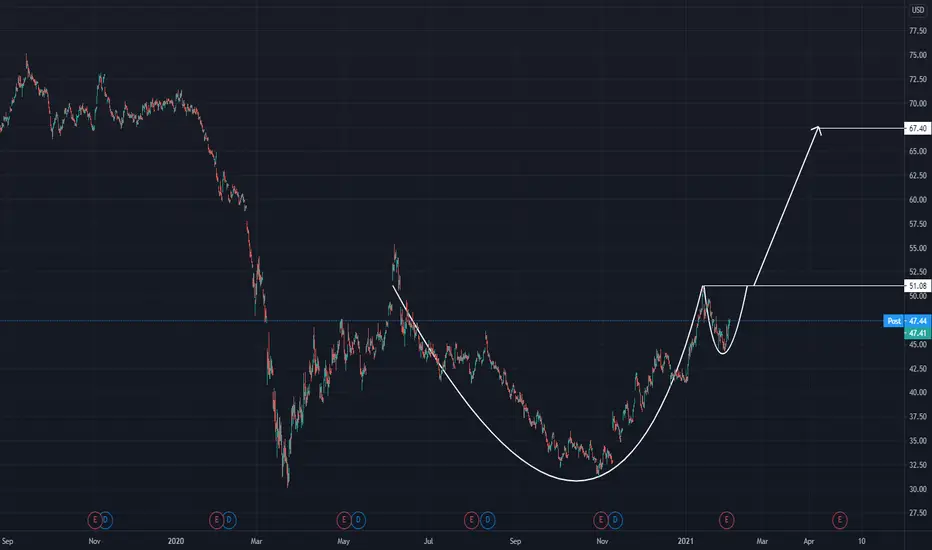
head and shoulders bottomTrading an Inverse Head and Shoulders Conservatively
An investor can wait for the price to close above the neckline; this is effectively waiting for confirmation that the breakout is valid. Using this strategy, an investor can enter on the first close above the neckline. Alternatively, a limit order can be placed at or just below the broken neckline, attempting to get an execution on a retrace in price. Waiting for a retrace is likely to result in less slippage; however, there is the possibility of missing the trade if a pullback does not occur.


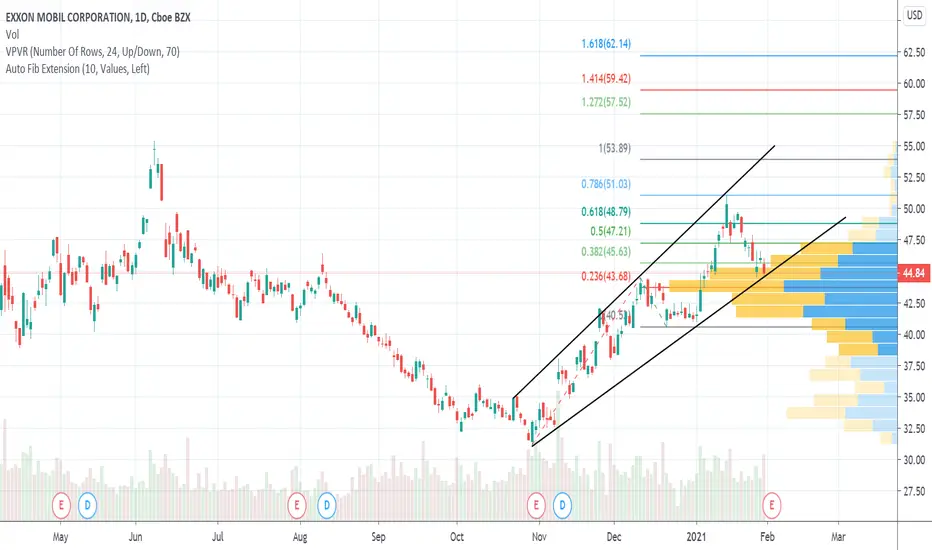
Short to 44.00Since Jan 14th XOM has been in a bearish direction. It closed at 47.44 which is also near 61.8% fib level. My idea is that it'll drop to 44.00. 44.00 being marked out from my fib extension tool as well as where my support zone is at. After it hits that price then it can make its way back into a bullish direction for the longterm.
If you agree with my analysis please like or comment your input.


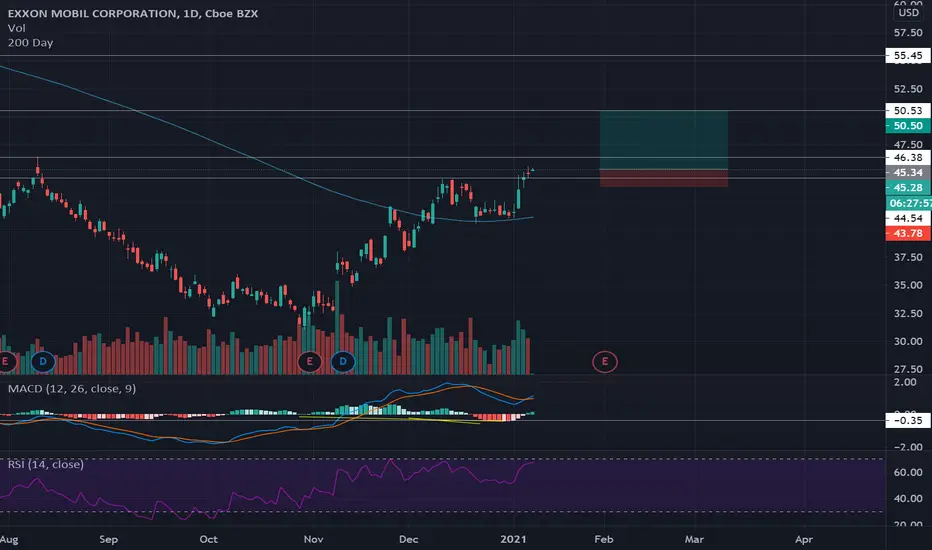
Exxon LT (February 2nd 2021)Exxon Mobil (XOM) (February 2nd 2021 through 2022)
Low: $32
High: $45
2020 Q4 announcements are in a few hours.
My assessment is as follows:
I believe the guidance could be reported as negative above all else.
I think EPS has a very slim chance to barely exceed analyst expectations of 1 cent, maybe 2 to 5 cents at the max, but I'm watching for it to end up being a really close call at around -2 or -3 cents too.
My original thought for my Cindicator forecast last night was that trading for the day could close positive but I think there's an even slimmer chance of that now that I've taken some more time to assess.
I think the current patterns could turn into a longer running contracting triangle, and it looks most like it will result in heavy bearish swings lower if it does finally break out in 2022, maybe as low as $23 to get started. I'd say its well known that oil is a dying industry and I believe it will reflect in the charts more and more as time goes on.
Thanks for tuning in :) Disclaimer, anyone in the trade needs to do their own due diligence and decide what is right for YOU. My charts can be wrong at any time and it's very important that you have your own strategies and plans in place. I run this channel for my own educational purposes of learning to trade, and I will never be 100% right, so please do not let me confirm any bias for you! (Dangerous to do so, stay safe and remember the basics & rules of risk assessment.) Expect the unexpected and happy trading!

$XOM - solid r/r into earnings. Looking for $53.89Support on volume shelf with a decent upwards channel.


backtest and resumptionContinuation of uptrend after test of previous resistance, bull ish divergence on multiple time scales

XOM Old Energy, The Transition to Clean Energy Will Take YearsOil hitting the negatives was a once in a lifetime event in my opinion. We may see it's use go down over the years but when the transition to clean energy begins, it'll take decades for the world to transition. XOM or any other company isn't going anywhere for a very long time.

XOM - EW analysis - 5th of C wave upXOM - It seems like one more high as 5th of C wave is about to start before the cycle gets finished. Buy only when start outperforming the SPX in smaller time frame.
Give thumbs up if you really like the trade idea.

XOM Q4 EREnergy sector cooling before ER season. And still bullish. Supports and resistances showed on graphic.

XOM BearishEnergy sector as a whole is getting beat up right now, and Exxon is giving bearish signals.
Negative momentum, failure to fill a gap, low volume

$XOM NEW setup$XOM has been playing nicelt according to our plan so far, now it has presented us with a new oppourtunity forming a new (POI) zone. If the price retraces back to our zone then we can look forward to go long and out next TP will be around $54 (1st TP). As always SL under the zone but make sure to leave some cushion.
Trade Safe.

Watch for the JumpI entered in a long position here at $52 for 30 contracts expiring at the end of January. Cashing out at $55 when it reaches the top of the trading range of the automatic rally.


$XOM HBD on Daily with gap to fillThere is a resistance that needs to be broken, but there is HBD on the daily. If it can break the resistance there it is likely to fill the gap around 50. Not financial advice..
Bullish on EXXON (XOM) – Target USD 45.00NYSE:XOM
- Downward trend line from August 2020 broken in October 2020
- On a weekly time frame, positivedivergence RSI/Price
- MACD showing a possible reversal, however still way below 0.00
- Target price at USD 45.00, major area of resistance in April - June 2020
What do you think?


ABC BullishABC and target is D/Possible pull back..
ABC targets are often calculated using the length of the AB leg and fib levels. As a rule, stop goes under C for this pattern or last pivot low..A can not be below B..
XOM looks to be forming a CUP, but I can not find a handle yet. The one I see is below mid cup of 43.28 which would invalidate the pattern..Sometimes the handle low can be practically at cup break out..55.46 right now but this would be an intra-year cup. Long entry, if cup forms, would be 55.56.
Targets 2 are longer term targets..
This one is way down from it's high so may be a struggle going back up plus oil is known to be volatile. Gr8 dividend tho! There are buyers that are stuck up there and feeling financial pain, who will sell on every rally..
The fall from the rising wedge was not too far but almost looks like a make shift handle, it is just not high enough to be a valid handle, but still looks like support may lurk there..
So I stick with ABC bullish for now with a possible cup forming (o:
Yearly high is 69.58. 3 year high is 89.30. 20 year high is 117.20..
Recently overbought on daily RSI set at 80 for overbought level. Has dipped out of overbought territory for now. Looks like a small pull back may be coming for some reason..dunno why i think that...lol ..but there is a wick on top of the last green weekly candle and the last monthly candle and no bottom wick...but not quite an inverted hammer...plus it is not at the bottom of a downtrend in the most recent shorter term uptrend
The inverted hammer is a type of candlestick pattern found after a downtrend and is usually taken to be a trend-reversal signal. The inverted hammer looks like an upside down version of the hammer candlestick pattern, and when it appears in an uptrend is called a shooting star. The Inverted Hammer candlestick formation occurs mainly at the bottom of downtrends and can act as a warning of a potential bullish reversal pattern. What happens on the next day after the Inverted Hammer pattern is what gives traders an idea as to whether or not prices will go higher or lower..
XOM dipped out of it's rising wedge which are often bearish and represent too much buying without healthy pullbacks and a rising wedge can mess with supply and demand. A strong stock may simply take a brief dip under the RW bottom trendline, then resume it's prior trend..
I would wait for a good entry if you like this stock. I have owned it since it was right above C so helps me hold on because I have not had to look at red on a daily basis on my account. That can be psychologically damaging..lol..looking at that loss everyday if we do not get entry right. I am guilty of selling just because I do not like looking at the ongoing loss day after day. Perhaps this is where longer term investors who do not look at their portfolio on a daily basis have an edge (o';
Not a recommendation/just an observation.
