FWOGUSDT trade ideas

$FWOG - Long Trade IdeaMEXC:FWOGUSDT | 4h
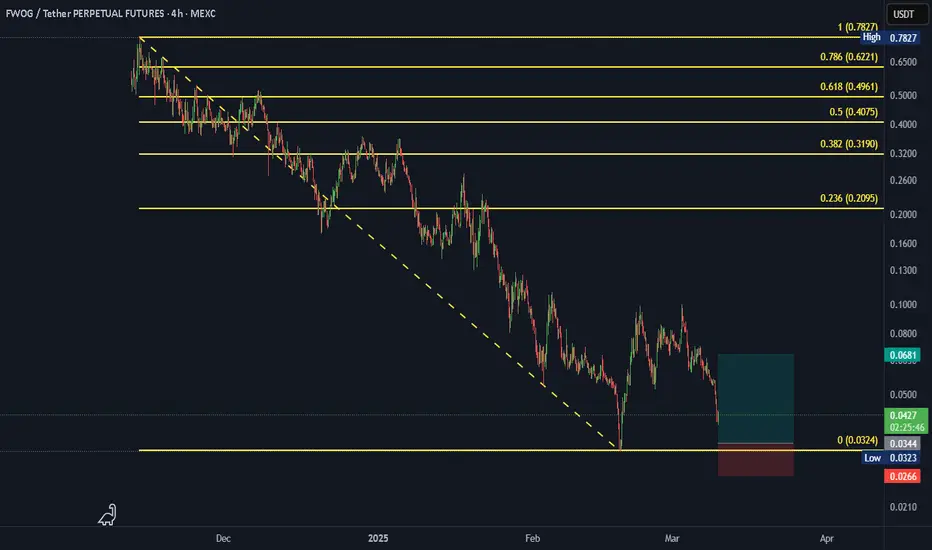
Price has retested its base support at .0050 on the lower timeframes.
Hold .052-.050, we could potentially push toward the mid-range at 0.065–0.068
If momentum continues and Bitcoin holds above 104k, we can target 0.074–0.080 level

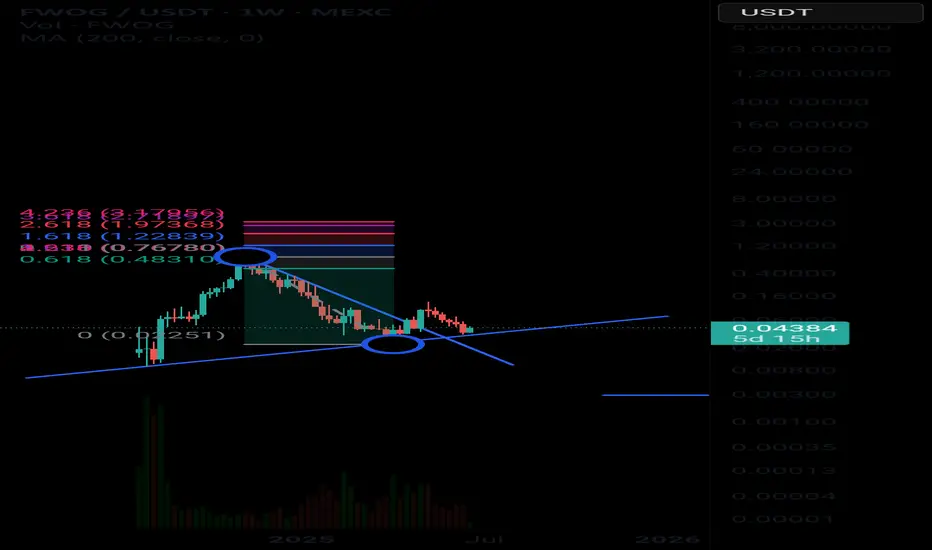
$FWOG/USDT Ready to Fly MEXC:FWOGUSDT has officially broken out of its long-term downtrend and flipped the key resistance zone into support.
After a clean retest of the breakout level around $0.07021, the price is showing strength again.
With bullish momentum building, this setup offers a solid potential upside, targeting the $0.52424 zone, a 643% move from here.
As long as the price holds above the green demand zone, this chart looks primed for a strong rally.
DYRO, NFA


$FWOG 3-months Consolidation Breakout $FWOG just broke out of its 3-month consolidation zone, and I longed it before the breakout!
After ranging tightly since February, it finally pushed above resistance with solid momentum.
Up nearly 20% today let’s see how far this breakout runs!
Chart looks nice

$FWOG 3-Months Consolidation Breakout $FWOG just broke out of its 3-month consolidation zone, and I longed it before the breakout!
After ranging tightly since February, it finally pushed above resistance with solid momentum.
Up nearly 20% today let’s see how far this breakout runs!
Chart looks nice

FWOGUSDT: The Sleeping Giant Awakens!
📊 Chart Breakdown:
- Current Price: 0.072
- Volume: 1.44M (Liquidity building!)
- Key Levels:
- Support: 0.022 (Massive demand zone!)
- Resistance: 0.0850(Break = Moon mission!)
🔥 Creative Analysis:
FWOGUSDT is coiled like a spring! After a wild dip to 0.022, buyers stepped in HARD, pushing price back into the 0.07 zone. The tiny +0.08%move today? Just the calm before the storm.
🎯 Big Idea:
The Phoenix Trade 🦅
- Entry: 0.065 (Aggressive) or 0.062 (Safe)
- Targets: 0.080 → 0.084 → 0.087 (Parabolic!)
- Stop Loss: Below 0.059 (Only for the brave!)
💡 Why This Works:
- Volume Spike: 1.44M shows interest.
- Symmetrical Triangle: Tightening for a BIG breakout!
- Sentiment Shift: Bears got trapped at lows → Short squeeze fuel!
🚨 Meme-Worthy Twist:
FWOG-USDT isn’t just a token—it’s a VOLCANO. Quiet now… but when it erupts, EVERYONE will notice. 🌋
📌 Final Thought:
This is either a generational buy or a heartbreaker. Watch for the 0.085 break —it could send FWOG to the stratosphere!
👍 Like & Follow for more high-impact setups! #FWOG #AltSeason2025 #100xGems 🔥

FWOG LONG ALL trading ideas have entry point + stop loss + take profit + Risk level.
hello Traders, here is the full analysis for this pair, let me know in the comment section below if you have any questions, the entry will be taken only if all rules of the strategies will be satisfied. I suggest you keep this pair on your watchlist and see if the rules of your strategy are satisfied. Please also refer to the Important Risk Notice linked below.
Disclaimer
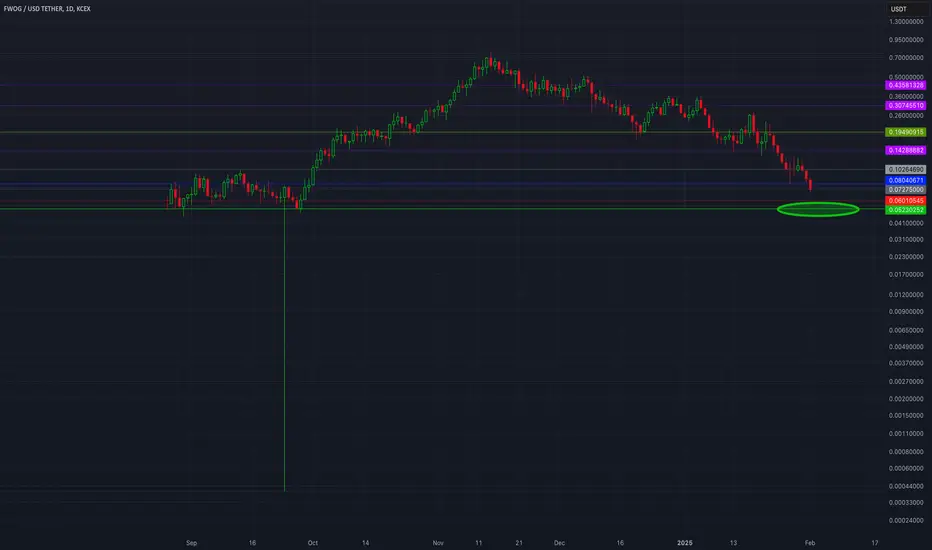
$FWOG ANALYSIS! If price reaches the green support zone 🟩, there is a potential long entry 📈 as buyers could step in and push the price up again.
⚠️ Waiting for confirmation before entering a long position from this zone.


BUY BUY OR BYE BYE FROGGY This thing came full H&S circle__ ones, again proving the most predictable bear pattern.
IF it bounces__ PT .22 .30
FWOG/USDT AnalysisThe price is approaching the resistance zone in red.
🎯 Targets if breakout occurs:
1️⃣ First Target: Green line level
2️⃣ Second Target: Blue line level

FWOGUSDT: Approaching the Turning Point – What’s Next?FWOGUSDT is trading at $0.12006, hovering just above its absolute low of $0.11783, established only hours ago. This marks a staggering -84.6% retreat from its absolute high of $0.78189, reached just 72 days prior. With RSI14 dipping to 29.42, the asset is entering oversold territory, raising the stakes for a potential reversal or a continuation of the bearish trend.
A surge in sell volume, as confirmed by recent VSA patterns, highlights increasing market activity amidst uncertainty. The asset is also testing critical resistance at $0.13946 while struggling to break above the 50-day moving average of $0.15193, emphasizing the importance of this consolidation phase.
Is the market setting the stage for a bullish rebound or bracing for deeper lows? With macroeconomic factors such as volatile liquidity conditions and heightened market sentiment, the next move could offer opportunities for both traders eyeing quick scalps and investors seeking long-term positioning.
The big question remains: Are you ready to seize the moment, or will this opportunity pass you by? Stay tuned as we dive deeper into the technicals and strategies for this critical juncture.
Roadmap: Tracing FWOGUSDT’s Path Through Pattern Dynamics
FWOGUSDT has had a whirlwind of activity in recent trading sessions, as highlighted by a sequence of critical patterns. Below, we’ve broken down the roadmap of these patterns in order of their emergence, filtering only the ones that delivered accurate directional moves based on the previous pattern’s main direction.
Pattern 1: Increased Sell Volumes (Jan 21, 18:00 UTC)
The market initiated a significant sell wave, closing at $0.21192 after an open of $0.22732, marking a notable drop. The main direction was clearly bearish, and this pattern laid the groundwork for subsequent sell-offs.
Pattern 2: Buy Volumes Takeover (Jan 23, 20:00 UTC)
Despite a brief bullish attempt that pushed the price to a high of $0.16481, the market turned back to bearish territory, aligning with the previous sell-off. This confirms the direction set earlier, showing the strength of sellers.
Pattern 3: VSA Buy Pattern Extra 1st (Jan 25, 00:00 UTC)
Here, the market attempted a reversal, with a closing price of $0.12599 and a high of $0.13648. While buyers showed strength, the follow-through failed as the price closed lower in subsequent sessions. This indicates the struggle of bulls to reclaim control.
Pattern 4: Increased Sell Volumes (Jan 25, 02:00 UTC)
The most recent sell-off, aligning perfectly with the earlier bearish direction, confirms the dominance of sellers. With a low of $0.11783, FWOGUSDT reached its absolute bottom. This marks a critical juncture for traders.
Key Takeaways
The bearish trends dominated, with multiple sell patterns confirming the overall downtrend.
Bullish patterns showed potential but failed to break critical resistance, indicating weak momentum.
The most recent bearish breakout to $0.11783 highlights the market’s vulnerability at these levels.
What’s Next?
Investors and traders should watch for sustained price action at critical support zones. Will the bulls finally stage a comeback, or is more downside ahead? Follow the roadmap to stay in tune with the market's rhythm!
Technical & Price Action Analysis: Key Support and Resistance Levels
When it comes to navigating the FWOGUSDT price action, the key levels below are your bread and butter. Let’s break it down:
Support Levels
These zones are where buyers are likely to step in. If the market doesn’t respect these, expect them to flip into resistance faster than you can blink:
$0.11783 – This is the absolute low. If broken, we’re diving into uncharted waters.
$0.29444 – A strong psychological area to watch if prices stage a rally from current levels.
Resistance Levels
Here’s where sellers are holding their ground. Break these, and the bulls might just get the upper hand:
$0.13946 – The first line of fire for any upward push.
$0.19064 – A significant hurdle for medium-term bulls.
$0.23757 – Beyond here, the market might just start cooking.
$0.25695 – The final boss level for this structure.
Powerful Support Levels
These are your safety nets if the market wobbles. But if they give way, you’re looking at resistance zones in the making:
$0.29444 – Not just a level, but a fortress for the bulls to defend.
Powerful Resistance Levels
While none were detected in this cycle, keep an eye on the levels above as potential magnets for price.
Pro Tip: If these levels don’t play out, the market could be flipping the script, turning support into resistance or resistance into support. Keep your eyes peeled and trade smart!
Trading Strategies Using Rays: Optimistic and Pessimistic Scenarios
The "Rays from the Beginning of Movement" concept provides traders with dynamic levels derived from Fibonacci principles. These rays form a predictive framework, guiding price action from one ray to the next. Interactions between rays and moving averages (MAs) further confirm key market zones. Let’s dive into the strategy.
Concept Overview
Rays and Fibonacci: Rays are constructed at precise angles that correlate with the start of a trend.
Dynamic Levels: The rays adjust to new patterns, providing an updated roadmap for price movement.
Key Interaction Points: Trade entries are based on price reactions to rays, confirmed by interaction with MAs.
Directional Flow: Price moves from one ray to the next, making each ray a potential trade target.
Scenarios and Strategies
Optimistic Scenario
This assumes the price successfully interacts with a ray, confirming bullish momentum.
Initial Entry Point: Interaction at support ray near $0.11783 (absolute low).
First Target: $0.13946 (next ray and first resistance level).
Second Target: $0.19064 (medium-term ray resistance).
Confirmation Tools: Price above MA50 ($0.15193) signals upward momentum.
Pessimistic Scenario
In this scenario, the price interacts with a resistance ray and begins to reverse, confirming bearish sentiment.
Initial Entry Point: Rejection at resistance ray near $0.13946.
First Target: $0.11783 (absolute low and ray support).
Second Target: $0.29444 (long-term powerful support zone, now acting as resistance).
Confirmation Tools: Price below MA50 ($0.15193) reinforces a downward trend.
Suggested Trades
Bullish Trade Idea :
Enter long at $0.11783 after confirmation of ray support and MA interaction. First target $0.13946, with stop-loss below $0.11700.
Bearish Trade Idea :
Enter short at $0.13946 upon rejection. First target $0.11783, with stop-loss above $0.14000.
Scalp Trade Idea :
Trade between $0.13946 and $0.19064 for quick profits within the ray structure, confirming movement via the MA50.
Final Thoughts
Dynamic rays and MAs act as a dual system for identifying actionable trades. Always enter after a confirmed interaction and let the price move between rays for optimal profit opportunities. Adapt to new ray formations and keep an eye on volume surges for added confirmation. This strategy offers precision for both cautious and aggressive traders.
Your Feedback and Ideas Matter!
Hey traders, thanks for taking the time to explore this analysis! If you’ve got questions or ideas, don’t hesitate—drop them in the comments. I love seeing your thoughts and will do my best to respond to everyone.
If this idea resonates with you, hit Boost and save it to your favorites so you can revisit it later and track how the price moves along my levels. This is the cornerstone of successful trading—understanding the points where trades can be made with confidence.
For those curious about my indicator-strategy, it automatically plots all the rays and levels, simplifying your analysis. While it’s available privately, feel free to DM me if you’re interested in using it—I’m happy to share details.
Need a custom analysis for your favorite asset? Let me know in the comments! I’m open to doing some for free and posting them here, or working on something private if you’d prefer to keep your ideas exclusive. The rays work on any asset, and I can craft a personalized layout just for you.
And of course, if you’d like to see more of my work, follow me here on TradingView. This is where I post all my articles and strategies, so don’t miss out!
Trade smart, stay curious, and let’s keep the conversation going! 💬📊

FWOG Showing Some StrengthFWOF Bouncing of that Weekly FVG and show relative streng here. Look like goog RR for the long set up.

FWOG/USDT: 35% Upside Target | Rising Wedge FormationFWOG/USDT Analysis:
Current price: $0.28 (-0.97%)
Key levels:
- Resistance: $0.34-0.35
- Support: $0.26-0.27
Pattern: Rising wedge forming with potential breakout zone at $0.34
Trade setup:
- Entry: $0.26-0.28
- Target: $0.34 (35% potential upside)
- Stop loss: Below wedge support ~$0.24
- R:R ratio: 1:2.5
Watch for:
- Volume confirmation at breakout
- Support level holds
- Rising trendline integrity
DYOR - This is not financial advice. Always manage risk and position size appropriately.

FWOG approaching Buying ZoneKey Levels:
Previous Weekly Wick: This level is shown in green. It represents inefficient price delivery which price will be looking to to fill (trade back into).
PWH: Previous Weekly High
Imbance / W: Weekly Imbalance which is visible on the Weekly Timeframe.
This suggests potential support, where price may stabilize or reverse.
Entry Zone: A highlighted region in red below the current price, where price could find an entry point for longs. We want to see structure break to the upside which would confirm us to take a long position.
Trade Setup:
Look for Entries: The ideal entry could be near the marked red zone where the price may find support or demand, offering a low-risk long position.
Take Profit: The previous weekly wick level can be a key resistance target. Monitor price action around this level to decide whether to lock in profits.
Stop Loss: A stop loss can be placed below the marked imbalance area or below the support region.
Summary: The focus is on looking for entries near the marked red zone (support area) and targeting a potential upward move toward the previous weekly wick as the resistance level.
Be mindful of any price action near the support and imbalance levels for confirmation of entry.

$FWOG - Long Trade Idea (Swing Point Retest)The price has reached 200% of the Fibonacci level from the high and was rejected at the first level of the supply zone at .27
If we can get a valid swing point retest or continue to hold .16, we can start scaling into long positions with an initial target of .27 to .30
Stop below .15
Potential Targets:
tp1 - .27-.30
tp2 - .36-.40
tp3 - .47-.50

Opportunity Awaits on $FWOG - Scaling In Soon! I’m waiting to scale in at 24c, with a potential to add at 20c if conditions allow. Watching for a retest of the recent impulse move.
For this to happen, BTC would need to drop below 90k and into the low 80k range. Not expecting it unless we see that significant BTC pullback.
This is a macro play, and I’m willing to wait a couple of weeks to see how it plays out.
MEXC:FWOGUSDT

$FWOG/USDT breaking out $FWOG/USDT breaking out of an Expanding Triangle and targeting $0.36442 with a strong risk-to-reward setup. Are bulls in control? Let’s see!

$FWOG - Long & Short Trade Idea$FWOG fell below 1.618 fib level, and this usually end up dropping to 2 fib level.
However, we might get a reaction at .185 to .175 for a retest (could be a good scalp targeting .25 to .26 (1.618 fib)
Then from there, will see if we get a rejection to short it to $.14-ish

Will $FWOG gets back to its all-time high?$FWOG is picking up steam, looking like it's bouncing back big time.
$FWOG was inspired by CRYPTOCAP:PEPE , boasting a huge community and distinctive art. The narrative around $FWOG remains solid, with the community buzzing with excitement.
Technical Outlook:
We're seeing $22.82 million in trades over the last 24 hours, which is pretty hefty for a meme token, indicating active trading interest.
With a market cap of about $337.43 million, $FWOG's up there with the big dogs in the meme coin world.
Price bounced off the daily demand and now challenging its local resistance.
If we can break .35 resistance, we can see it going to .48-50 level
Local support is around .29-.30, where we can see the highest volume being traded.
Will $FWOG gets back to its all-time high? It's gonna be nuts!

FWOG Long SetupFWOG has dropped to a strong support level, where I’m also expecting a bounce. The downtrend breakout is confirmed; now it’s just a matter of waiting for a pullback to start building a long position.
