
BUND trade ideas


Bund 4 hMy lovely german bund. Last update was wrong. That's happend an now i see more long cause the indices are weak.
Look at the chart and comment if your interested. Thank's for your time and good luck guys.

Strength in Investment-Grade Debt Shows Flight to Safety$TLT #Bonds #bund #gild #treasuries
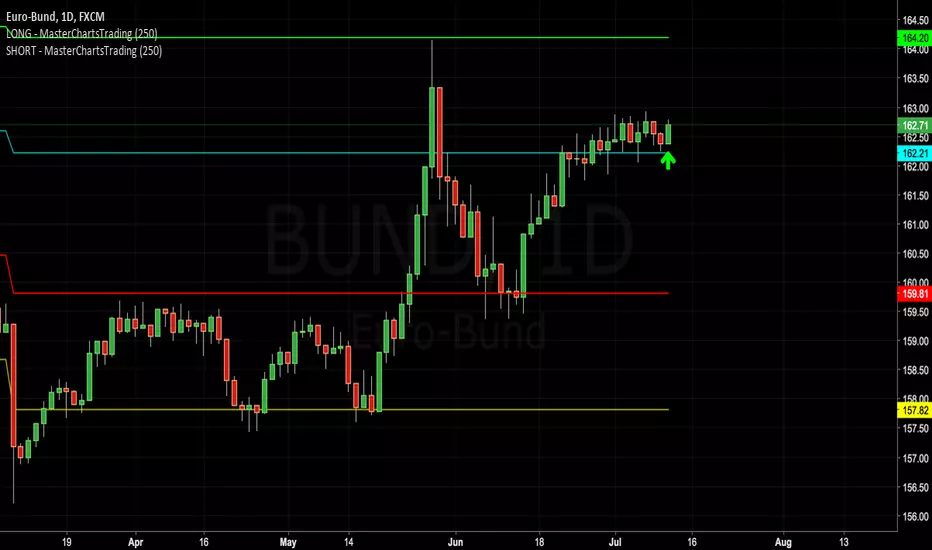
These custom support resistance indicator lines show decent places to enter or exit.
The Blue indicator line serves as a Bullish Trend setter.
If your instrument closes above the Blue line, we think about going Long.
If your instrument closes below the Red line, we think about Shorting.
For Stocks, I prefer to use the Yellow line as my Bearish Trend setter (on Daily charts).
Find out more. Send Private Mail (PM) to @MasterCharts
Bunds at Crossroads#Bund chart is at a very critical point. This area had previously served as both resistance and support multiple times before. If bulls manage to break this stiff resistance upwards we can say the reflation trade is going to be dead for a long time, but if they fail and price descends impulsively, yields will soar globally and stock markets will crash.
Good luck,
Ali Sharifazadeh, CFTe

BundThe Bund is on the way to 161,00 may be a little more. Than we must look what happen.
When the Indicies fall more, than it is clear for me. But only for me!
Please trade your own plan and much luck to all.

Time to go long Gold and short BondGold had a nice start on new year as it decidedly broke above important resistance 1300 while Bond continuously sank and Stocks were flatted that made Commodities/ Bond ratio strongly rise up, Commodities/ Stocks ratio is bottom out.
We may enter the Stage 5 of the Business Cycle when asset allocation go to Commodities because inflation build up and interest is rising up around the world. 2018 should be a year of Gold, Oil
stockcharts.com
Trading strategies;
- Wait Gold pull back at 1305-1310 to go long for long-term, short-term target at 1360
Stop loss at 1295
- Short Euro Bond (BUND) at 161.3, short-term target at 158.3
Stop loss at 162

Suddenly I Grow Cautious About Stocks. #Options play: Euro-BundSell towards new #support or buy towards #resistance? $TLT $STUDY

Bund 4 hSo Bund is very strong. over 163,00 or 162,70 is long for me till high may be a little more bevor he came down to 163,00 - 162,00 till 7.th dez.
Under 162,70 we go more down bevor up!
The 10y german yield can confirm that if we close there under 33 BP so watch out and good luck.
invst.ly


1.Buy the bund just got this trade, if we check the daily, we see it is a break out of a double bottom structure, thus, we could enter at current level and looking for a 1:1 distance movement.
success
RandR


Ribasso Bund, a 162.75Con stop 163.25 e take a 161.2S
Sul livello di ingresso la lettere non dov'essere cosi colpito in modo forte come i valori attuali, de'vessere più colpito in denato. Segnale ed idea di Am su Lftv

BUND - LongLooking to go long on the third touch of the upwards sloping trend line. There is currently very strong bearish pressure, but for the RR I am seeing potentially from this trade it meets my criteria for a 1% risk. If price action doesn't look good due to the gap down on the Sunday night open my bias could change as price may well play down further. If this is the case I'll be sitting on my hands until later notice here.

BUND - LongAfter a break of the top downwards sloping trend line part of the wdedge that's recently formed here. Re-test and then I'm long, tight stop here as there is crossing over the longer term weekly and monthly upwards sloping trend line also. Good RR of 1:5 here so worth the trade for me at a 2% risk.
If price tanks today before the weekend I'll either cancel the order if not hit, or potentially look to close out before SL if price action doesn't show any long potential

Bund 4 hBund is after contract changing on the down move with little corrections. 161,00 / 160,00 is minimum for me. I don't wonder when we see a low 158,50/00 and than up.
And look at the option on eurex. There you can read the way (when you understand it). Good luck for all.
The big fall is not yet. Cause the Draghis buy mor till next year. Than we can look in the first - second quater where the markets fall. And i mean a big fall!

Bundwe have now a big run. If the indices goes more down that is what i think (cause DAX 11800/500) than we see next week 165,00 at BUND but not more for me.
So watch out till the market turn's into downtrend. At the next rollover at Sept.8th we see 161,00 or lower!
Look at your plan and good luck to all.

Bund Trading In A Minor Triangle CorrectionBund is trading quite slow, choppy and overlapping since September of last year which gives us an idea that a bigger Elliott Wave triangle correction within wave 4 consolidation is in the making. If that is the case, then more slow price action may follow on Bund and ideally afterwards make a new recovery into black wave 5 as part of a higher degree Elliott wave ending diagonal .
At the moment however, we see wave b trading in final stages and searching for resistance near the upper triangle line
Disclosure: Please be informed that information we provide is NOT a trading recommendation or investment advice. All our work is for educational purposes only.


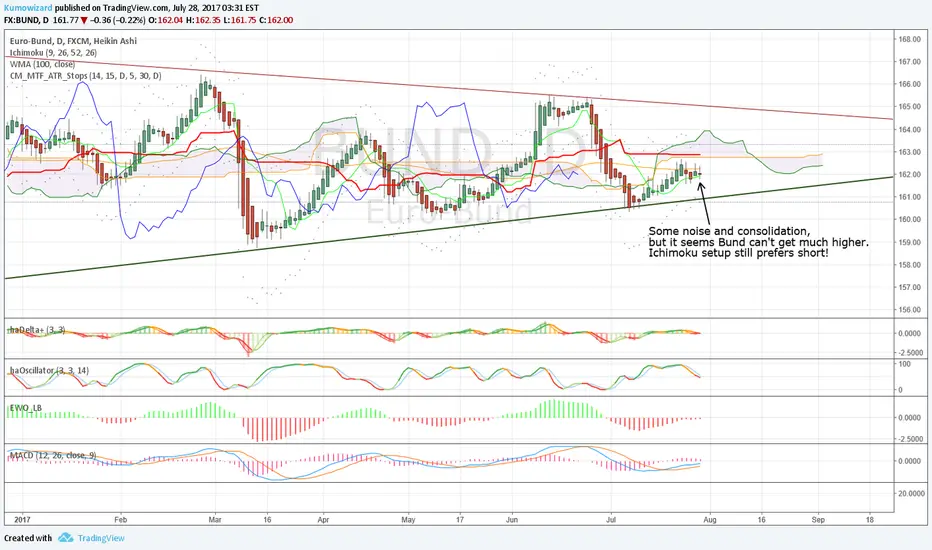
Consolidation, but short still has better risk/rewardNothing new.
Just keep outright short positions, and your Fixed-Income portfolio hedged via Bund, Bobl and other bond futures short, or in some cases pro traders may consider paying IRS.
This way you won't be shocked when the real bond selloff armegeddon happens. Or you will be shocked only by how much money you made :-)
Bund bearish ABCD rally and bear flag.The rally from the 07 July low has reached the bearish ABCD measured move objective at 162.67. This is also the 200 day MA and strong resistance. The topping pattern and bearish price action suggest a reversal here and downtrend resumption. The rally from 07 July looks like a bear flag and a break down has a target of 157.20

bund showing signs of sell offtweezer tops and bearish engulfing, missed this first time round and the tweezers on point 2, am going with the market here for a sell to break this bottem
