CANNABIS BASKET * TC FIB WEEKLY ANALYSIS1. Long-Term Downward Channel : The price has been contained within a long-term descending channel, and it remains below the upper boundary of this primary channel. The fact that the price has stayed within this structure suggests that the broader downtrend may still be intact unless there is a strong breakout above this channel’s upper resistance line.
2. Support and Resistance Zones : The price is currently testing resistance near the $1,600 range. There are multiple Fibonacci levels, such as the 0.382 and 0.5 retracement levels, aligning closely within this range, suggesting a significant resistance zone. If it can decisively break above these levels, it could target higher resistance levels at around $2,571.11 (0.5 level) and $3,091.33 (0.618 level).
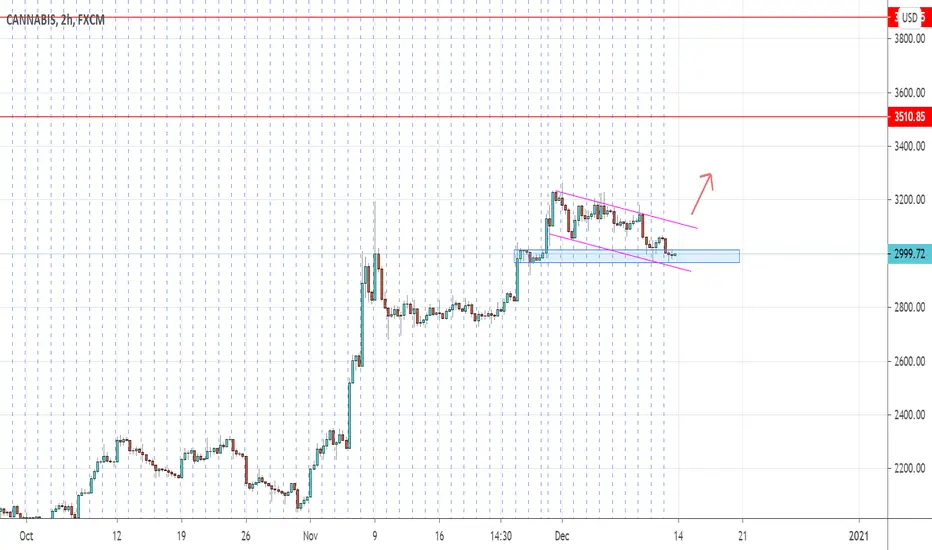
3. Short-Term Ascending Channel : Within the larger downtrend, a new ascending channel has emerged, indicating a bullish trend on a smaller time frame. This suggests that, in the short term, the price has shown strength, though it is approaching the upper boundary of this smaller channel as well.
4. Fibonacci Cluster Zones : Fibonacci retracement levels form clusters in certain areas, particularly between $1,500 and $1,800 and again around $2,500. These clusters tend to create zones of strong support or resistance and could influence the price movement in these regions.
5. RSI Bearish Divergence : The updated RSI (Relative Strength Index) shows a bearish divergence, indicating that, while the price has been rising, the momentum behind these moves is weakening. This could be an early warning signal that a correction or pullback may be approaching if it fails to clear its immediate resistance zones.
6. Potential Pullback Levels : Should the price fail to break higher, it may retrace to support levels such as $1,380, or even back toward the recent lows around $1,016.57 and below if bearish sentiment strengthens.
Summary:
The chart suggests that the cannabis index is at a pivotal point. It’s testing major resistance levels within both long-term and short-term trend structures, and the bearish RSI divergence suggests that momentum may be weakening. A breakout above the $1,800-$2,000 range with sustained volume could validate a bullish reversal. However, failure to break higher might lead to a correction towards lower support levels.
CANNABIS trade ideas

CANNABIS STOCKS BULLISH TREND INTO 2024The president of USA has issued a pardon for marijuana use nationwide. This is bullish and can start a new trend into 2024.
Weekly breakout since bearish downtrend 2 years ago.
Comments below

High on Pot!Happy Saturday to all traders! I Respect the GRIND. Today I happened to take a look at Cannabis and the chart looked fantastic, let me know what you think:
1) Cannabis has been in a rising wedge pattern, which almost always shows a upcoming breakout. It is also at the end of the pattern, so it should happen soon.
2) Secondly, 20 day SMA crossed above the 50 day. Also called the 'golden cross,' it shows the asset has been on fire recently and is starting to turn up.
3) Most importantly there was a very large RSI Bullish Divergence from July to October. This occurs when the price is falling, but the Relative Strength index is rising, which signals growing momentum. Using this, we can infer that Cannabis is reasonably oversold.
4) Lastly, as an add on, I included the Parabolic SAR. As you can see, the SAR dots are still under the price, which has occurred from the beginning of September. This is very incredible because it has not significantly dipped for months!
Therefore I am long on Cannabis, and hope you agree! Thanks.

CANNABIS Technical AnalysisHey traders, in the coming week we are monitoring CANNABIS for a selling opportunity around 1950 zone, once we will receive any bearish confirmation the trade will be executed.

A clear pullback scenario for the cannabis industrySeeing the growth and innovation that has occurred in recent months shows that the big wave is incoming. This formation clearly refers to pull back and bottom. Even one of the most conservative countries of Europe; Poland has given the Market Authorization to Tilray, Inc. (TLRY). Also, the election vibe has been taking charge of global media, federal legalization would be the starting point of new stoned FOMO.

Cannabiscannabis industry, which is expected to hit $billions in sales. Trends looks to be switching up, Look for the best Cannabis stocks maybe?

Buying Cannabis. Trading stocks, too.
We've now gotten finally down into the long term support level on this. We might be set to see a rebound in the weed market.

FXCM's Cannabis Basket's hourly showing potential momentum pushFXCM's CANNABIS basket is in the bullish area on the daily chart on the left. The hourly EMAs and stochastic are in bullish mode and potentially align short-term traders with the daily. The stochastic has moved into the upper quintile, and maintenance of this level (blue arrow) increases the chance of a successful trade. Trend following indicators may be useful in this case as a potential exit tool. Stop under hourly support in conjunction with risk management techniques.


Cannabis Index - Overbought, Looking for Retrace Before EnteringI have just closed a very profitable long on the cannabis index. This can only go up in the long run but I had to secure the profits. I am looking for this to retrace to between 0.5 and 0.618 Fibonacci before entering long again. It is very overbought on RSI across all timeframes so a correction needs to happen soon. Long term this will break all time highs (these do not show on this chart).

Cannabis Futures I don't own any cannabis futures but I've been following this sector closely. I think its flagging before another move up.