Bullish rebound?DAX40 (DE40) has bounced off the pivot which is an overlap support and could rise to the 1st resistance.
Pivot: 21,775.24
1st Support: 21,501.86
1st Resistance: 22,374.35
Risk Warning:
Trading Forex and CFDs carries a high level of risk to your capital and you should only trade with money you can afford to lose. Trading Forex and CFDs may not be suitable for all investors, so please ensure that you fully understand the risks involved and seek independent advice if necessary.
Disclaimer:
The above opinions given constitute general market commentary, and do not constitute the opinion or advice of IC Markets or any form of personal or investment advice.
Any opinions, news, research, analyses, prices, other information, or links to third-party sites contained on this website are provided on an "as-is" basis, are intended only to be informative, is not an advice nor a recommendation, nor research, or a record of our trading prices, or an offer of, or solicitation for a transaction in any financial instrument and thus should not be treated as such. The information provided does not involve any specific investment objectives, financial situation and needs of any specific person who may receive it. Please be aware, that past performance is not a reliable indicator of future performance and/or results. Past Performance or Forward-looking scenarios based upon the reasonable beliefs of the third-party provider are not a guarantee of future performance. Actual results may differ materially from those anticipated in forward-looking or past performance statements. IC Markets makes no representation or warranty and assumes no liability as to the accuracy or completeness of the information provided, nor any loss arising from any investment based on a recommendation, forecast or any information supplied by any third-party.
GER30 trade ideas

DAX Bullish ReversalDAX Index (GER30) Trade Setup – 1H Chart Analysis
The DAX Index (GER30) is showing signs of a potential bullish reversal from a key support zone. The price has reacted at 21,975.87, indicating a possible upward move. A retracement to the **62% Fibonacci level (22,534.21) presents an optimal buy entry with a well-defined risk-to-reward ratio.
Trade Details:
- **Entry:** **22,534.21** (62% Fibonacci retracement)
- **Stop Loss (SL):** **21,975.87** (Below the recent swing low)
- **Take Profit Targets:**
- **TP1:** **23,476.14** (0% Fibonacci level)
- **TP2:** **24,056.53** (38.2% Fibonacci level)
- **TP3:** **24,995.45** (100% Fibonacci extension)
Analysis & Justification:
✔ Key Support Confirmation** – The price bounced off **21,975.87**, a significant support level.
✔ Fibonacci Confluence** – The 62% retracement level aligns with historical reaction zones.
✔ Moving Average Resistance** – A breakout above **22,600** could confirm bullish momentum.
✔ Risk-to-Reward Ratio** – The trade offers a **minimum 1.7:1 ratio**, improving with higher TP levels.

Paradigm Shift: Markets in Tension over Trump's New TariffsBy Ion Jauregui - Analyst at ActivTrades
The recent announcement of tariffs by Donald Trump's administration has generated a wave of uncertainty in financial markets. This measure could trigger a forceful response from the European Union, marking a paradigm shift in global trade and in the European bloc's economic strategy.
Reactions in Europe and the ECB
Christine Lagarde, President of the European Central Bank (ECB), has stressed the need for Europe to move towards greater economic independence. Her statements suggest that the EU will not back down from protectionist measures and that its fiscal and financial policy will have to adapt to this new global context.
It can be sensed from the statements that countries such as Germany and Italy, with a strong dependence on automotive exports, could be among the most affected. In addition, strategic sectors such as steel and aluminum would face an increase in production costs and possible interruptions in supply chains. Spain and Poland could be affected in the strategic raw materials sector as one of the most powerful net exporters in Europe. Especially Spain, given that it dedicates a large part of its aluminum exports to the North American country.
Economic and Financial Impact
A tariff-based trade war could slow growth, increase unemployment and generate a disinflationary or even deflationary environment not only in the United States but also in the European economic region. In this context, the bond market has begun to discount further interest rate cuts, reflecting declines in longer maturity yields and break-even inflation rates. Expectations of Europe, and even traditional allied countries Canada and its rapprochement with Europe, as well as Japan and Korea showing approaches to China, could be demarcating a red line for the White House in terms of its foreign policy form. What Trump will have to consider if the market begins to respond so negatively to such an “enemy of trade” attitude, and especially such a “bad friend” to his traditional allies. Another key factor to consider is the NATO-NATO section where Europe may eventually displace the US from the grouping.
DAX Analysis (Ticker AT: GER40)
The German index has started the Asian session with a sideways movement and 2 hours before the European opening there have been strong falls after the alliance comments in Asia. The situation of the index seems to have reached a floor around 22,241 points generating a possible support this Wednesday. If we look at the trend, the index has reached highs twice last month on March 6 and 18, marking on the second occasion a new milestone trading at 23,480.22 points, generating a return to a range where the index is comfortable this year between 22,918 points and 22,105 points, with the annual lows at 22,209.21 points. The current situation is indicating a possible golden crossover to reverse the current situation. The Current Control Point (POC) is located at 22,967.56 points, so it would not be unusual with the increase in volume and with an oversold RSI at 44.93%, it is possible that the index climbs to 22,522 points in its mid-range zone and try to pierce if the news accompanies the Euro zone and in particular Germany and the companies that make up the index. If this happens, we could see an advance to the upper part of the range slightly below the indicated checkpoint.
Future Outlook
If the Trump administration maintains its uncompromising trade strategy, pressure on European financial markets could intensify. The EU, for its part, will have to assess possible countermeasures to protect its economy and maintain stability in an increasingly challenging environment. At ActivTrades, we are closely following these developments and their impact on global markets.
*******************************************************************************************
The information provided does not constitute investment research. The material has not been prepared in accordance with the legal requirements designed to promote the independence of investment research and such should be considered a marketing communication.
All information has been prepared by ActivTrades ("AT"). The information does not contain a record of AT's prices, or an offer of or solicitation for a transaction in any financial instrument. No representation or warranty is given as to the accuracy or completeness of this information.
Any material provided does not have regard to the specific investment objective and financial situation of any person who may receive it. Past performance is not reliable indicator of future performance. AT provides an execution-only service. Consequently, any person acing on the information provided does so at their own risk.

Long on GER30 I Short term tradePrice has cleared yesterdays low, sell side liquidity and it has also accumulated buyside liquidity on Asian session. Overall trend is still bearish waiting for further confirmations in HTF to go short.

DAX – 60-Minute Chart AnalysisLet’s see if this Elliott Wave count plays out as anticipated.
🔸 Invalidation Level: 22,716.4 (CFD – GER40, Capital.com)
🔸 Downside Targets: 21,752 and 21,612
A sustained move above the invalidation level would negate the current bearish wave structure, while continued weakness below recent swing highs keeps the downside scenario in play.

Trading GER30 on Tariff DayToday will be a big day for the stock market in 2025. The tariffs to be implemented promises to either make or break the market.
Last week we saw a massive sell off and on Monday and Tuesday we have seen the markets gain a decent amount. However here is what needs to be noted for all indexes:
1) The Daily downtrend is intact
2) The H4 MA is pointing down
3) On GER30,we see a bat pattern to sell
4) H1, M30, M15 is OB and has a double top
We should not follow the news, but instead focus on the charts. Based on this, we will enter a short position and expect the market to resume the downtrend.
Stop loss will be 200 pips around 25700. Good luck!

GER40 (DAX 40) AnalysisThe German DAX 40 index (GER40) recently tested key support around 22,063.63 and exhibited a bullish reaction.
📈 Bullish Scenario:
If GER40 sustains above 22,063.63, it may push towards the 22,775.84 resistance zone.
A break above 22,775.84 could open the way for a break and retest, potentially leading to a continuation towards the 23,395.75 resistance level.
📉 Bearish Scenario:
If the price fails to hold above 22,063.63, further downside towards 21,231.97 may be observed.
⚠ Risk Disclaimer: This analysis is for informational purposes only and does not constitute financial advice or a trading signal. Market conditions can change rapidly, especially in light of recent geopolitical developments. Always confirm market conditions using your own strategy before making any trading decisions.

4-hr Germany 40: Price Meets Important Resistance in Down TrendOver the past week, the DAX has experienced a sharp decline, plunging by an astonishing 3,400 points. This downward movement is not isolated, as its international counterparts, such as the UK100 and US100, are also facing significant losses. This widespread market downturn suggests a prevailing risk-off sentiment among investors.
Given the current conditions, we anticipate a further decline of approximately 700 points. Our outlook is reinforced by the appearance of the "death cross," a well-known technical pattern signaling a bearish trend. Historically, this formation has been a reliable indicator of continued selling pressure.
To capitalize on this movement, we executed a sell trade at 22,490, a key level coinciding with the 38% Fibonacci retracement. This level has repeatedly acted as strong resistance in previous market cycles, making it a strategic entry point for our trade.
Considering the heightened market volatility, we have implemented a stop-loss (SL) with a 2% buffer from our entry price. This allows for some flexibility while mitigating excessive risk. By combining technical analysis with prudent risk management, we aim to navigate the ongoing bearish momentum effectively.

DAX INTRADAY at crossroads awaits US tariffs The DAX40 continues to exhibit bullish sentiment, breaking out from a period of sideways consolidation and pushing toward previous resistance and all-time highs (ATH). The prevailing uptrend supports further upside potential, with key resistance levels in focus.
Key Support and Resistance Levels
Resistance Level 1: 23,446
Resistance Level 2: 23,815
Resistance Level 3: 24,000 - 24,420
Support Level 1: 22,575
Support Level 2: 22,204
Support Level 3: 21,814
Conclusion:
The positive reaction to fiscal spending plans and geopolitical developments reinforces the bullish sentiment for DAX40. A sustained move above the nearest resistance at 23,446 could pave the way toward higher targets, while holding above support at 22,575 is crucial to maintaining the uptrend.
This communication is for informational purposes only and should not be viewed as any form of recommendation as to a particular course of action or as investment advice. It is not intended as an offer or solicitation for the purchase or sale of any financial instrument or as an official confirmation of any transaction. Opinions, estimates and assumptions expressed herein are made as of the date of this communication and are subject to change without notice. This communication has been prepared based upon information, including market prices, data and other information, believed to be reliable; however, Trade Nation does not warrant its completeness or accuracy. All market prices and market data contained in or attached to this communication are indicative and subject to change without notice.

The DAX is declining in an impulsive structureThe XETR:DAX appears to be tracing a five-wave impulsive decline from its recent high on March 18, 2025. In Elliott Wave theory, an impulsive structure consists of five distinct waves. Wave 1, 2, 3, 4, and 5 as motive wave moves the direction of the prevailing trend, which in this case is downward. This pattern indicates a strong, directional move, with waves ((i)), ((iii)), and ((v)) being motive (driving the decline) and waves ((ii)) and ((iv)) serving as countertrend corrections.
Starting from the March 18 peak, wave ((i)) likely initiated the downturn which ended at 22723.19. It was followed by a corrective wave ((ii)) rebound towards 23204.59. Wave ((iii)), typically the longest and most powerful in an impulsive sequence, should push the index lower with momentum. A smaller corrective wave ((iv)) is then expected to follow, offering a brief bounce. Then wave ((v)) should complete the structure, potentially finding a bottom. The impulsive nature suggests that each motive wave ((i)), ((iii)), ((v))) subdivides into its own five-wave pattern, reinforcing the bearish outlook.
Key levels to watch include support zones where prior corrections have held. Exact targets however depend on the unfolding wave lengths and Fibonacci relationships. Expect further downside until the fifth wave concludes. Afterwards, a larger corrective rally could emerge. This view aligns with sentiment for a continued near-term decline in the XETR:DAX , driven by an impulsive bearish sequence.

GER40 ShortGER40 short on the regression break.
Global markets are under pressure - I will not take this trade.

GERMAN 40 LongGerman 40 closed at low on Friday
but going up to fill the gap.
Also Hedge funds are selling while commericials buying.
Time to buy for me.
I dont use price action,because i dont believe in it.Instead I use my commercial analysis
to buy and sell

Weekly Technical AnalysisStart your week by identifying the key price levels and trends.
The SpreadEx Research team has analysed the most popular markets, including stocks, indices, commodities & forex.
--------------------------------------------------------------------------------------------------------------
Analysis
Germany 40 has shifted into a corrective phase within what is still just a bullish trend overall, currently trading around 22,042, below its 20-day VWAP of 22,850. The RSI at 37.2 reflects weakening momentum, aligning with the recent downside break. Immediate support lies at 22,043. A reversal above resistance at 23,551 would be needed to revive bullish sentiment.
UK 100 remains in a neutral, consolidative phase after stalling from earlier gains. It’s quoted at 8,553, just under its 20-day VWAP of 8,644. The RSI of 39.2 shows a loss of momentum, leaning slightly bearish. Key support is marked at 8,500, and only a break above 8,763 would signal fresh upward traction.
Wall Street continues in a bearish trend with a corrective bounce already having rolled over as of Friday, currently at 41,299—just below the VWAP of 41,814. An RSI of 36 (having failed to overcome the 50 level) suggests a lack of bullish conviction. The key downside level is 40,840, while 42,787 stands as initial resistance on any recovery.
Brent Crude holds a bearish trajectory but the corrective move is gathering steam, trading at 7,289, above the 20-day VWAP of 7,131. The RSI at 55.2 is neutral, offering little directional clarity. Immediate support sits at 6,856, while 7,405 will test further upside.
Gold continues to sprint into record highs, quoted at 3,117 and well above the 20-day VWAP of 3,004. The RSI at 76.8 is firmly in overbought territory, highlighting stretched momentum but also strength. While some pullback could occur, support is seen way back at 2,883, with the recent highs acting as near-term resistance before 3200.
EUR/USD sustains its bullish setup as it undergoes a dip trading at 1.0814, marginally below the VWAP of 1.0848. The RSI at 55.7 leans constructive though lacks strong momentum. Near-term support is at 1.07476, while 1.09489 is the next resistance zone to watch for continuation.
GBP/USD is still bullish as it sits in a tight correction, priced at 1.29306, holding above its 20-day VWAP of 1.29302. The RSI at 57.1 supports the ongoing trend but shows moderation from previous highs. A break below 1.28721 may trigger caution, while further upside needs a break of 1.30069.
USD/JPY holds a bearish trend but it has flattened out and is currently in a corrective bounce, quoted at 149.30 and near its VWAP of 149.30. RSI at 47.2 remains neutral. If sellers regain control, support is at 147.00. On the upside, clearing 151.12 could shift sentiment back toward bullish territory.

Oversold RSI vs. bearish wave count The market shows strong bearish dominance with price (22,207.79) below all key moving averages (EMA200: 22,743.51).
3 Bearish Confirmations:
ADX 35.85 + -DI (36.59) > +DI (11.27) = strong downtrend
RSI 28.53 shows oversold but no reversal momentum
MACD (-139.49) remains below signal line (-116.26)
Price struggles below Camarilla pivot (22,680.36) with immediate resistance at 22,534.35 (R1)
Multiple POTENTIAL downward patterns identified (Flat/Downward Candidates & Diagonal Structures)
Recent wave structures suggest Wave 3 extension in progress below 22,207
Contradiction: Oversold RSI vs. bearish wave count suggests possible relief rally before continuation
Action: SELL LIMIT
Entry Zone: 22,680-22,800 (61.8% Fib of recent swing high)
TP1: 22,156 (S1) | TP2: 21,853 (S2 Classic)
Stop-Loss: 22,900 (above EMA200)
Risk/Reward: 1:3.5 to TP2
Position Size: Risk 1% capital (220 pips risk)
Investor Summary
High-risk buying opportunity only if:
Daily close > EMA200 (22,743)
MACD bullish crossover
RSI sustains > 45
Accumulation zone: 21,800-22,200 with tight stops
Precision Trading – How Our Trade Played Out PerfectlyIntroduction
In trading, precision and patience are everything. We don’t chase trades—we wait for the perfect confluence of technical factors to align. This trade idea followed our systematic approach, utilizing ranges, Fibonacci levels, internal & inducement liquidity, break of structure (BOS), entry confirmation patterns, and harmonics. Here’s a breakdown of how it all unfolded.
1. Identifying the Range
Before executing, we mapped out the market structure to establish a clear range. The price action showed a well-defined consolidation zone, which helped us anticipate liquidity grabs and potential reversal points.
2. Fibonacci Confluence – 78.20% Level
Using the Fibonacci retracement tool, we identified the 78.20% level as a strong reaction point. This aligned with other key technicals, increasing our confidence in the trade setup.
3. Internal & Inducement Liquidity
Liquidity is key in trading. We spotted internal liquidity zones where price was likely to manipulate weak hands before the actual move. Inducement liquidity was also present, providing additional confirmation that price would tap into deeper levels before reversing.
4. Break of Structure (BOS) and Entry Confirmation
Once BOS occurred in alignment with our anticipated liquidity grab, we looked for our **entry pattern**. The market printed a textbook confirmation, allowing us to enter with precision and minimal risk.
5. Harmonic Pattern for Additional Confluence
The final piece of confirmation was a harmonic pattern, further validating our entry. These patterns, when combined with our overall strategy, add an extra layer of probability to our trades.
Trade Outcome
The execution was flawless! 🎯 The price respected our levels, moved in our favor, and hit our target zones with precision. This is the power of structured analysis and disciplined execution.
📉 Key Takeaway:Never trade blindly! Always have a solid confluence of technicals before taking a trade.**
🔎 What’s your go-to confirmation before entering a trade? Let’s discuss in the comments! 📩
#ForexTrader #ForexLifestyle #ForexSignals #DayTrading #TradingMindset #ForexMoney #PipsOnPips #ForexSuccess #ForexMotivation #MillionaireMindset #TradingStrategy #FXMarket #ForexWins #TradeSmart #MarketAnalysis #WealthBuilding #Investing #PriceAction #ChartAnalysis #Scalping #SwingTrading #FinancialFreedom #MakingMoneyMoves #HustleHard #NoDaysOff #MoneyMindset

GER40-SELL strategy 6 Hourly KAGIGER40 has upward pressure, and this will continue short-term. There are sufficient evidence to see a test of 23,150 again, and perhaps little higher.
Strategy SELL @ 23,250-23,450 and take profit near 22,750 again.

DAX: CORRECTION OR NEW TREND?Analyzing the 60-minute chart, I believe there is still room for further downside in order to complete what I interpret as a five-wave structure within a larger corrective wave C, which itself forms part of a broader wave 4 of higher degree.
This corrective phase appears to be unfolding within a clearly bullish long-term trend, as confirmed by the weekly chart, which remains well-aligned to the upside.
📉 Potential downside targets:
22,024
21,741
Once this corrective move is complete, I expect the uptrend to resume, potentially offering renewed long opportunities aligned with the prevailing weekly bullish structure.

ger 30 review GER shows a mild bearish undertone with potential for a larger drawdown if global risk isn't contained (I'll cover global risk in another post). Doing a top-down approach, the weekly chart is the most concerning—it signals a quarterly sell-off aiming to clear a long-range liquidity pocket. I'm eyeing 21480 as the profit-booking event, likely occurring around the 5.12-28.25 area.
Another eyesore is the pseudo swing at the 2.10.-3.10.25 range. Easy pickings here, as the semi-quarter liquidity pocket built during this span is just price establishing its first-half data entries. For a more immediate weekly play, sells to sweep 22,250 are easy calls—I wouldn't be surprised by an early-week sell-off, mid-week wick formation dipping into a WVol discount, and then continuation, or something similar within that cycle.
Important note: CC entries are nearly off the table completely, so what retail traders call "consolidation" will just be an easy shakeout. Eager sellers get chopped first, followed by breakout traders getting eaten alive. The golden signals to watch here are Cerberus calling weekly sells and a 3D Cerberus sell as well.
Moving to the daily intraweek forecast, we have a Friday jefe formation, but I'm not eager to play it as the simpler position is the DVol sell. There are still plenty of errors from the 2.21-3.4.25 span that haven't been cleaned up. Additionally, the 3.13.25 error CC just got cleared, helping form the jefe.
Early week, I'm anticipating a fake-out followed by a sell-off. By mid-week, we're aiming to clear the 2.21 error and set up the early month open trap. Note that the WVol entry will be the third leg on the 1M timeframe—easy sells for the larger sell-side target at the 1M CC entry. With this perspective, expect the fake-out potentially lasting until around 4.12.25, after which the real move unfolds.
Heading into April, don't be the fool trying to buy the "market structure shift, pullback" setups.

DAX 30th Marz 2025 - Recovering but not really! 20% Loss ahead!
The German DAX did an impressive rally during the last weeks. The Index has less losses than the SPX.
But- in the past, the DAX was never able, to hold his relative advantage to main indexes.
Technically side, the 3 Week Chart shows a special situation in RSI and Slow Stochastic, with predictable losses in the past.
All in all: Short recovery even with new highs possible, bu
t expect the Dax within the next 6 months much lower - price area around 17000 EUR:

Ger30Forecast:
Ger30 is looking bearish. Looking at the 1d, and 4d. I can say the is a possible bearish trend built up.
Technically the is 1d double top, 4h break of bullish trend. Current 4h bearish candlestick, and moving average confluence.

Bullish riseDax is currently in a bearish phase, where price action moving between 23200 and 22500. As of now, price action may garner bullish strength if it remains above 22500 to retest the nearest resistance barriers in red and maroon. Conversely, if it passes 22700-22800, the bullish rise may be intact because of breaking the smaller bearish channel from 22700 to 22500.
As long as the price action is above 22500 and settles above 22700, the index will retest the 23000 barriers. However, if the price fails to pass through 22700 and further declines from 22500, the index will likely continue its bearish correction.

15 minute continuation tredlineThe price has broken a 15 minute trendline and looks to go bearish
We had a breakout and retest and now go short
WE ONLY TRADE PULLBACKS

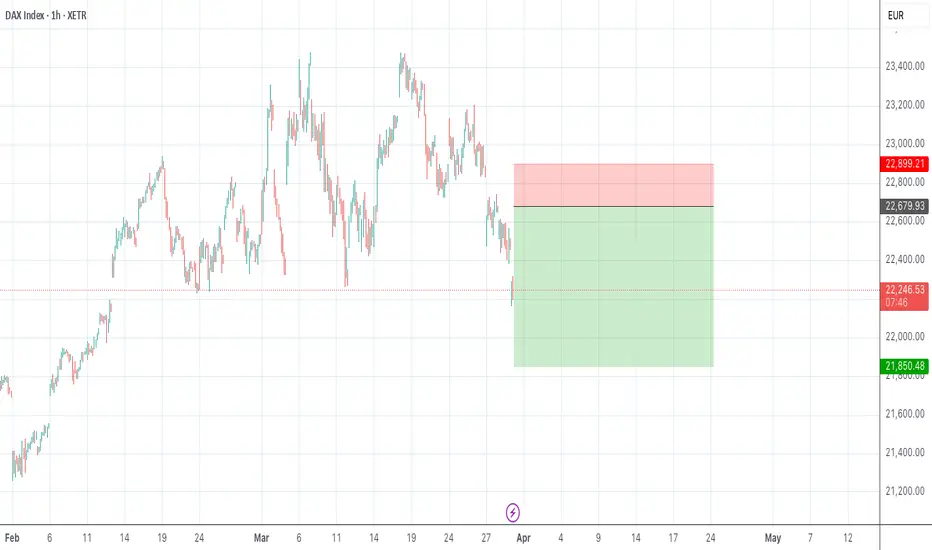
Bearish drop?DAX40 (DE40) is rising towards the pivot which is a pullback resistance and could drop tot he 1st support which acts as a pullback support.
Pivot: 22,764.15
1st Support: 22,381.49
1st Resistance: 23,185.90
Risk Warning:
Trading Forex and CFDs carries a high level of risk to your capital and you should only trade with money you can afford to lose. Trading Forex and CFDs may not be suitable for all investors, so please ensure that you fully understand the risks involved and seek independent advice if necessary.
Disclaimer:
The above opinions given constitute general market commentary, and do not constitute the opinion or advice of IC Markets or any form of personal or investment advice.
Any opinions, news, research, analyses, prices, other information, or links to third-party sites contained on this website are provided on an "as-is" basis, are intended only to be informative, is not an advice nor a recommendation, nor research, or a record of our trading prices, or an offer of, or solicitation for a transaction in any financial instrument and thus should not be treated as such. The information provided does not involve any specific investment objectives, financial situation and needs of any specific person who may receive it. Please be aware, that past performance is not a reliable indicator of future performance and/or results. Past Performance or Forward-looking scenarios based upon the reasonable beliefs of the third-party provider are not a guarantee of future performance. Actual results may differ materially from those anticipated in forward-looking or past performance statements. IC Markets makes no representation or warranty and assumes no liability as to the accuracy or completeness of the information provided, nor any loss arising from any investment based on a recommendation, forecast or any information supplied by any third-party.
