GER30 trade ideas


GER40 | Consolidation Range 24,600 – 24,000 With Breakout TargetGER40 is consolidating within a clear range between 24,600 resistance and 24,000 support. The lower boundary (24,000) aligns with the 61.8% Fibonacci retracement from the 23,050 → 24,600 impulse leg. A confirmed breakout above the range projects a measured move target of 25,197.2, which is derived from the 600-point height of the range between 24,000 and 24,600.
Support at: 24,000.00 / 23,678.5 / 23,050.00 🔽
Resistance at: 24,600.00 🔼
Range Target: 25,197.2 🎯
🔎 Bias:
🔼 Bullish: Clean break and hold above 24,600 confirms range breakout with target at 25,197.2.
🔽 Bearish: Break below 24,000 brings 23,678.5 and 23,050 into view.
📛 Disclaimer: This is not financial advice. Trade at your own risk.

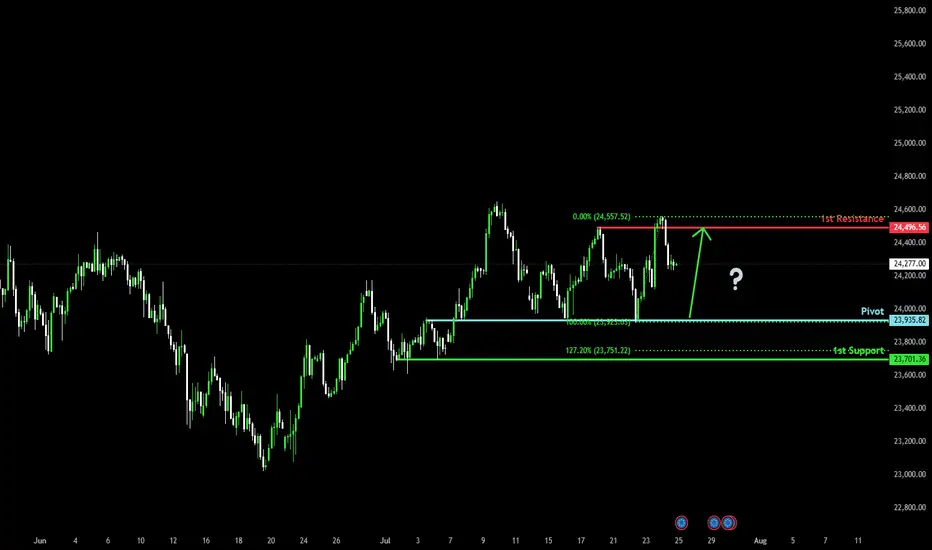
Bullish bounce off major support?DAX40 (DE40) is falling towards the pivot, which has been identified as an overlap support and could bounce to the 1st resistance.
Pivot: 23,935.82
1st Support: 23,701.36
1st Resistance: 24,496.56
Risk Warning:
Trading Forex and CFDs carries a high level of risk to your capital and you should only trade with money you can afford to lose. Trading Forex and CFDs may not be suitable for all investors, so please ensure that you fully understand the risks involved and seek independent advice if necessary.
Disclaimer:
The above opinions given constitute general market commentary, and do not constitute the opinion or advice of IC Markets or any form of personal or investment advice.
Any opinions, news, research, analyses, prices, other information, or links to third-party sites contained on this website are provided on an "as-is" basis, are intended only to be informative, is not an advice nor a recommendation, nor research, or a record of our trading prices, or an offer of, or solicitation for a transaction in any financial instrument and thus should not be treated as such. The information provided does not involve any specific investment objectives, financial situation and needs of any specific person who may receive it. Please be aware, that past performance is not a reliable indicator of future performance and/or results. Past Performance or Forward-looking scenarios based upon the reasonable beliefs of the third-party provider are not a guarantee of future performance. Actual results may differ materially from those anticipated in forward-looking or past performance statements. IC Markets makes no representation or warranty and assumes no liability as to the accuracy or completeness of the information provided, nor any loss arising from any investment based on a recommendation, forecast or any information supplied by any third-party.
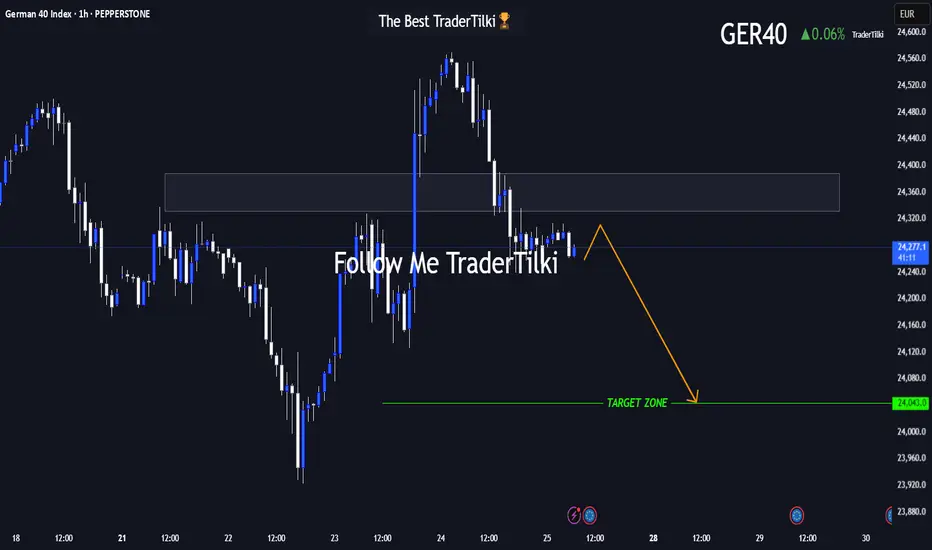
GER40 in Motion: This Setup Speaks Volumes 🌅 Good morning, my friends,
I’ve put together a fresh GER40 analysis just for you. Even if the 1-hour timeframe shows some upward momentum, I fully expect the price to reach my target level of **24,050**.
I'm holding firm until that level is hit.
Every single like from you is a massive source of motivation for me to keep sharing analysis. Huge thanks to everyone supporting with a tap!

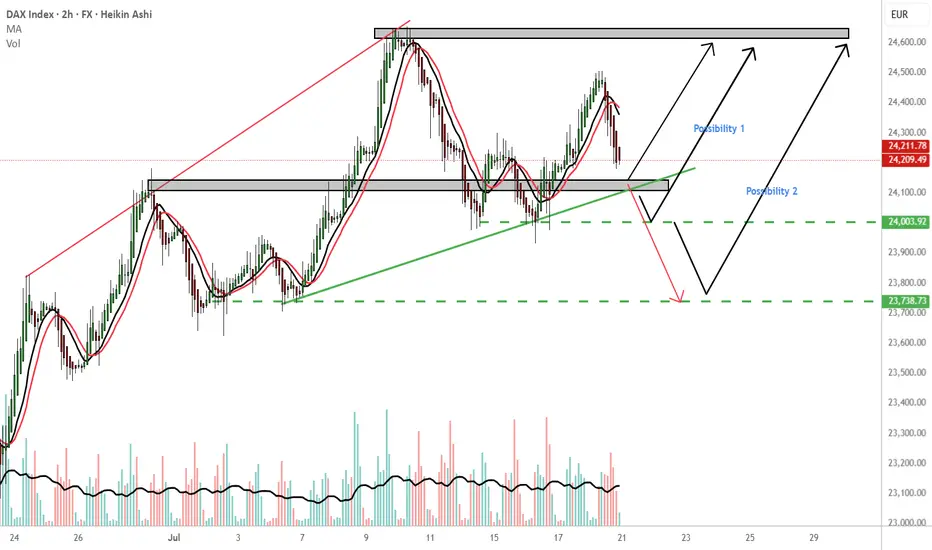
GER 30 endless possibilitiesMy most immediate outcome is reversal 24,140 price area. TP:24,600
Possibility 1: If Ger 30 holds the 24,000 price area i would consider a buy to 24,600.
Possibility 2: If Ger30 holds the 23,730 price area that would be another possibility for a buy. TP 24,600.
WCS: Worst case scenario, continuation downwards from the 24140 PL. Consider the red arrow. The 24,140 is a important price area please wait for confirmation
Please follow your trading plan.
THOUGHTS????
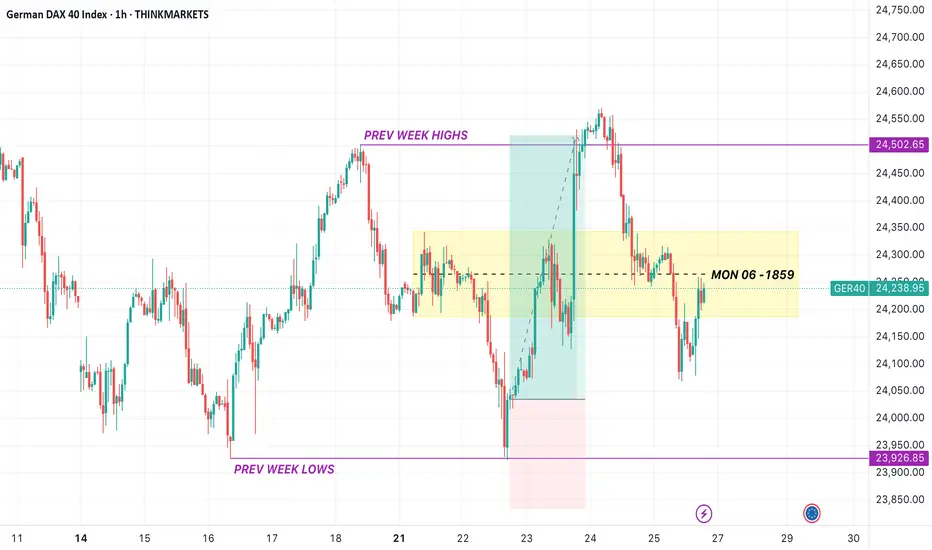
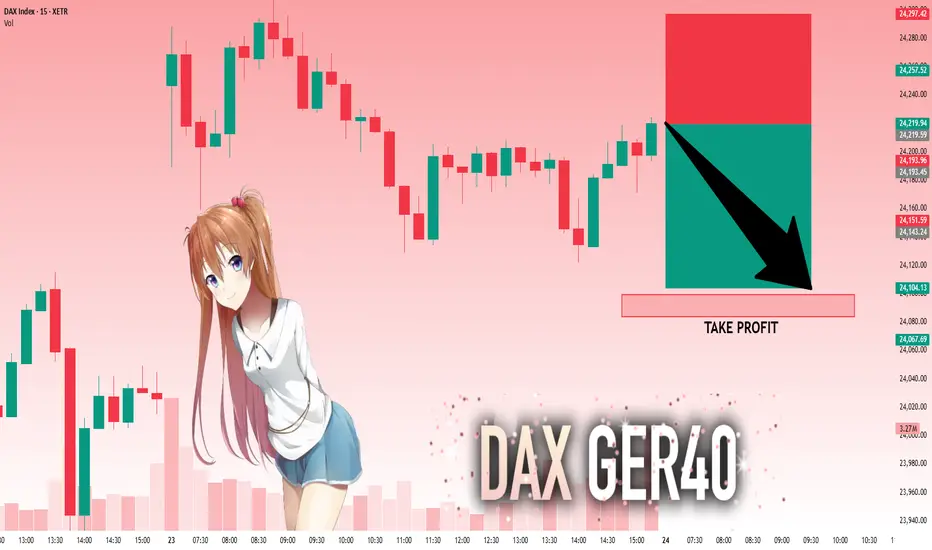
DAX: Target Is Down! Short!
My dear friends,
Today we will analyse DAX together☺️
The recent price action suggests a shift in mid-term momentum. A break below the current local range around 24,219.59 will confirm the new direction downwards with the target being the next key level of 24,099.27.and a reconvened placement of a stop-loss beyond the range.
❤️Sending you lots of Love and Hugs❤️
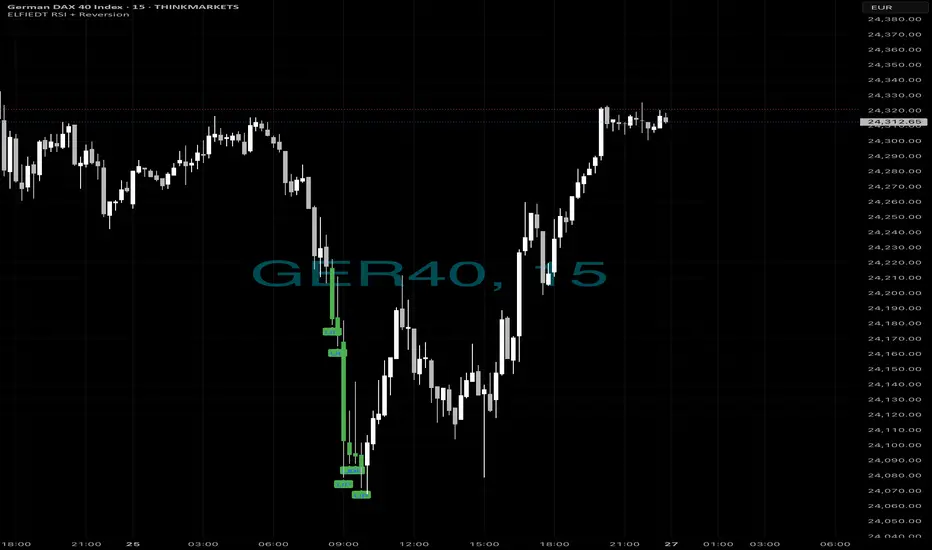
Same as always….📈 The Market Crashed. We Bought the Bottom. Again. 💥
Just another 15-minute chart… or is it?
While panic hit the DAX this morning, ELFIEDT RSI + Reversion was calmly printing BUY after BUY at the dead low. No guessing. No hype. Just precision.
✅ 5 Buy signals within minutes
✅ Picture-perfect mean reversion
✅ Price soared right after
✅ ZERO lag. ZERO repaint.
If you missed this move, don’t worry — this is what my system does.
🧠 Want to learn the logic behind this?
💰 Want to use it live on your own charts?
👉 Drop a 🔥 below if you want access.
👉 DM me “ELFIEDT” to test it out.
👉 Follow for real, repeatable setups.
DAX Bearichthe complete set up shoxs that Dax is ranging inside the internal zone , creating a double top on the 4H time frame, witing for the smal trigger to short the position
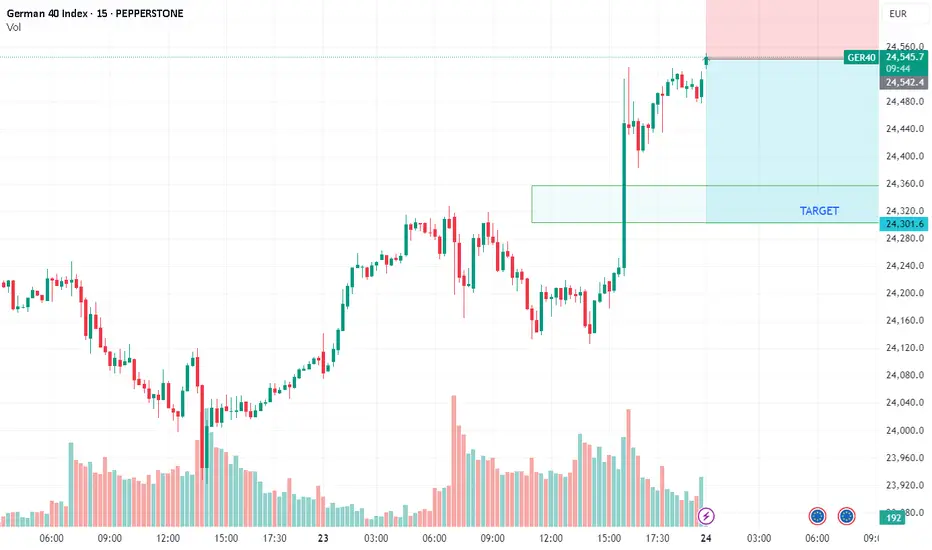
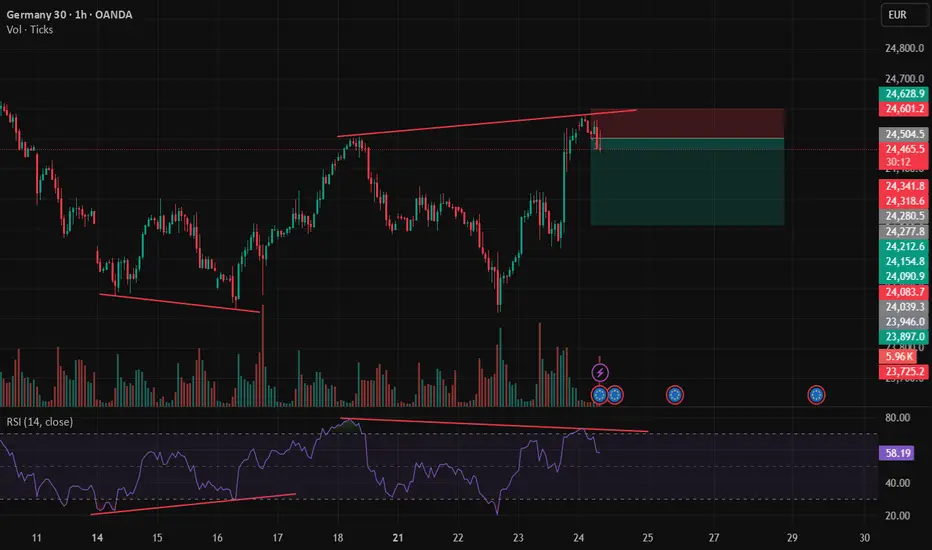
DAX/GER30 - TIME TO SHORT AT CURRENT PRICETeam, great win for the US30 on trade surplus 26 billion last month
expect to have great trade surplus over 300 billion
the Japanese went crazy 3.5% due to tariff drop from 25% down to 15%
The whole market has been pumping
We find an opportunity to SHORT THE DAX/GER 30 at the current level 24543-24556
STOP LOSS AT 24650
WITH TARGET at 24360-24320
PLEASE NOTE: once the price drop below 24500, bring stop loss to BE to protect your trade.
STICK TO THE PLAN.
Trendline BreakThe price has broken a bullish trendline followed by a pullback and now the price looks to go short
WE ONLY TRADE PULLBACKS

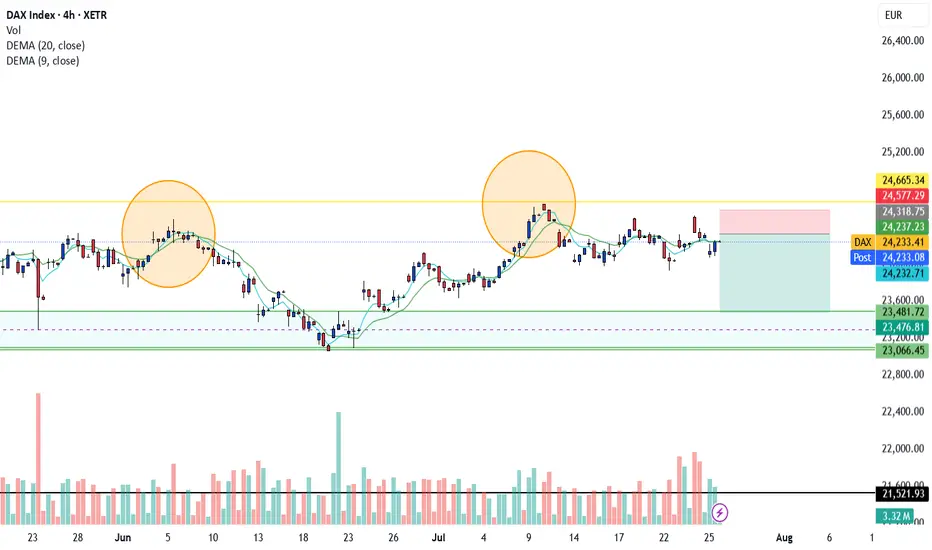
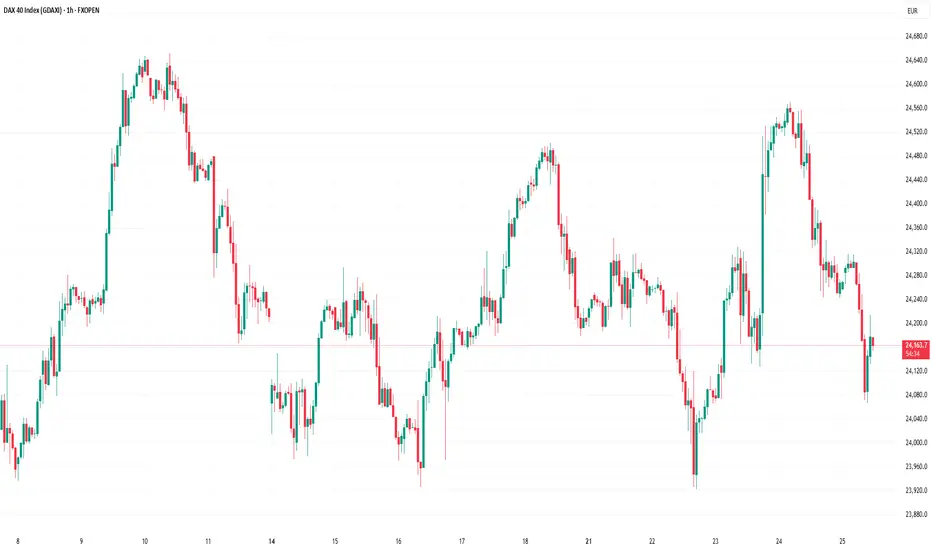
The DAX Index Is Losing Its Bullish MomentumThe DAX Index Is Losing Its Bullish Momentum
At the end of May, we noted that the German stock index DAX 40 was exhibiting significantly stronger performance compared to other global equity indices. However, we also highlighted the 24,100 level as a strong resistance zone.
Two months have passed, and the chart now suggests that bearish signals are intensifying.
From a technical analysis perspective, the DAX 40 formed an ascending channel in July (outlined in blue). However, each time the bulls attempted to push the price above the 24,460 level (which corresponds to the May high), they encountered resistance.
It is worth noting the nature of the bearish reversals (indicated by arrows) – the price declined sharply, often without intermediate recoveries, signalling strong selling pressure. It is likely that major market participants used the proximity to the all-time high to reduce their long positions.
From a fundamental standpoint, several factors are weighing on the DAX 40:
→ Ongoing uncertainty surrounding the US–EU trade agreement, which has yet to be finalised (with the deadline approaching next week);
→ Corporate news, including disappointing earnings reports from Puma, Volkswagen, and several other German companies.
Given the above, it is reasonable to assume that bearish activity could result in an attempt to break below the lower boundary of the ascending blue channel.
This article represents the opinion of the Companies operating under the FXOpen brand only. It is not to be construed as an offer, solicitation, or recommendation with respect to products and services provided by the Companies operating under the FXOpen brand, nor is it to be considered financial advice.
DAX40 Bullish breakout retest support at 24205The DAX remains in a bullish trend, with recent price action showing signs of a corrective pullback within the broader uptrend.
Support Zone: 24205 – a key level from previous consolidation. Price is currently testing or approaching this level.
A bullish rebound from 24205 would confirm ongoing upside momentum, with potential targets at:
24655 – initial resistance
24780 – psychological and structural level
25064 – extended resistance on the longer-term chart
Bearish Scenario:
A confirmed break and daily close below 24205 would weaken the bullish outlook and suggest deeper downside risk toward:
24100 – minor support
23921 – stronger support and potential demand zone
Outlook:
Bullish bias remains intact while the DAX40 holds above 24205. A sustained break below this level could shift momentum to the downside in the short term.
This communication is for informational purposes only and should not be viewed as any form of recommendation as to a particular course of action or as investment advice. It is not intended as an offer or solicitation for the purchase or sale of any financial instrument or as an official confirmation of any transaction. Opinions, estimates and assumptions expressed herein are made as of the date of this communication and are subject to change without notice. This communication has been prepared based upon information, including market prices, data and other information, believed to be reliable; however, Trade Nation does not warrant its completeness or accuracy. All market prices and market data contained in or attached to this communication are indicative and subject to change without notice.

Double top Double top on the Dax with RSI regular divergency. If are feeling brave enough you could let this run all the way down to 24k.
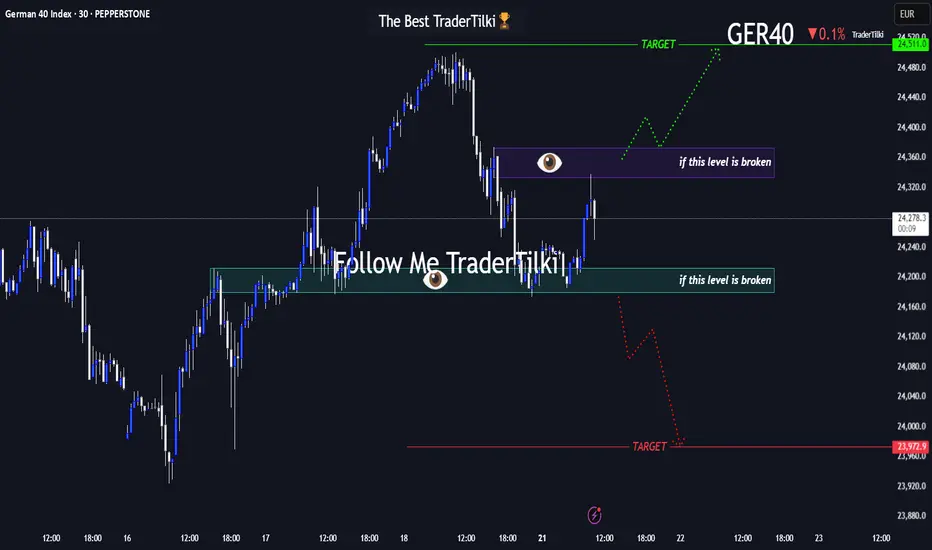
Before GER40 Roars, It WhispersHey guys👋
Here’s the latest GER40 analysis I’ve prepared for you:
🔻 If the **24,179** support level breaks, the next target is **23,972**.
🔺 If the **24,373** resistance level breaks, the next target is **24,511**.
🎯 I’ve shared two key levels with you — please monitor them carefully.
Every like from you gives me a big boost of motivation 🙏
Thanks to everyone who supports my work — truly appreciate it 💙
DAX / DE30 Long Day TradeXETR:DAX / ICMARKETS:DE30 taking a pullback towards up, catching this pullback.
These are good levels if you trade nicely.
Use proper risk management
Looks like good trade.
Lets monitor.
Use proper risk management.
Disclaimer: only idea, not advice

The Kiss of Death Trade & Other Reasons for EntryFollowing up on the 2618 opportunity that we looked at on the FOREXCOM:GER40 this past weekend the market has now created more potential trading opportunities to get involved.
1) A bullish bat pattern that has completed due to a result of a complex pullback into the original double bottom.
2) A potential Kiss of Death trading opportunity
3) A bigger potential bullish gartley pattern IF the current 2618 opportunity is violated.
Please leave any questions or comments below & feel free to share your opinion on the setup.
Akil

Rob the DAX! GER40 Bullish Mission Begins Now!🏴☠️GER40 Bullish Vault Heist! Target: 25400 🎯💼
🚨Mission Briefing: Robbery in Progress - DE40 / Germany40 Index Heist!
🎯 Plan: Bullish
🗂️ Asset: DE40 / GER40 “Germany40” Index
📦 Strategy: Thief’s signature Layered Limit Orders 🧱 (Multi-entry precision loading)
🔑 Entry Point:
"The vault is open 24/7! Thief goes in anytime 🔓💰"
Place multiple buy limit orders at recent swings / lows on the 15m-30m chart.
📲 Tip: Set alerts at breakout zones. Be early. Be greedy.
🚨 Stop Loss:
🎯 SL at 23,300 🔐 – beneath 4H structure (swing low wick-based).
Adjust SL based on lot size and number of active entries.
🏆 Escape Point (Target):
💼 25,400 = Target stash 💰
🔥 Use Trailing SL and ride the wave – exit before the trap if market hesitates!
📈 Scalpers / Swingers Alert:
💎 Only Long-side loot allowed!
💸 Small capital? Join the swing team 🚀
💰 Big capital? Front-run the breakout!
🎯 Trailing SL = Smart thieves protect profits.
🧠 Why Bullish?
The index is warming up after consolidation. Neutral bias flipping bullish 🔄 due to:
📰 Weakening macro shock absorbers
💣 Risk appetite reviving
💡 Institutional positioning + COT shift
🔄 USD reaction + EU equity flow
💼 Check all macro + intermarket juice for full confidence 📊🔗
⚠️ Risk Management Tips for Robbers:
🕰 Avoid news hour trades
🔄 Use Trailing SL always
📉 Don't chase… let the market come to you
👀 Eyes on economic calendar and VIX movement
❤️ Support the Robbery Crew!
💥 Hit that BOOST button if you love making money the Thief Way 🏴☠️
🎯 Help us grow the robbery empire & take over the charts 📈💰
🧨 Another Heist Plan coming soon! Stay sneaky, stay funded 🤑🐱👤💼
#ThiefTrader #GER40Plan #IndexHeist #LayeredLoot #MarketRobbery #FTSEStyleRobbery

DAX40 Pivotal trading zone at 23900The DAX remains in a neutral trend, with recent price action showing signs of a corrective pullback within the broader uptrend.
Support Zone: 23375 – a key level from previous consolidation. Price is currently testing or approaching this level.
A bullish rebound from 23375 would confirm ongoing upside momentum, with potential targets at:
23900 – initial resistance
24215 – psychological and structural level
24430 and 24620 – extended resistance on the longer-term chart
Bearish Scenario:
A confirmed break and daily close below 23375 would weaken the bullish outlook and suggest deeper downside risk toward:
23195 – minor support
23035 – stronger support and potential demand zone
Outlook:
Neutral bias remains intact while the Dax trades around pivotal 23900 level. A sustained break below or above this level could shift momentum.
This communication is for informational purposes only and should not be viewed as any form of recommendation as to a particular course of action or as investment advice. It is not intended as an offer or solicitation for the purchase or sale of any financial instrument or as an official confirmation of any transaction. Opinions, estimates and assumptions expressed herein are made as of the date of this communication and are subject to change without notice. This communication has been prepared based upon information, including market prices, data and other information, believed to be reliable; however, Trade Nation does not warrant its completeness or accuracy. All market prices and market data contained in or attached to this communication are indicative and subject to change without notice.

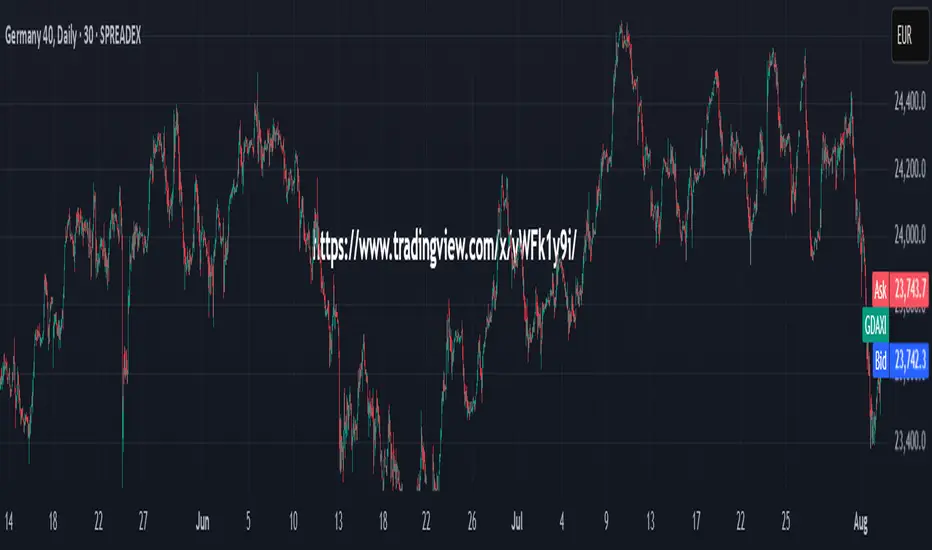
Technical Analysis WeeklyGermany 40 is now in a range-bound environment, currently trading at 23,630, below its VWAP of 24,150 and close to StdDev #2 Lower. RSI at 43 reflects weakening momentum. Support lies at 23,630 and resistance is seen at 24,740
UK 100 continues its bullish trend, undergoing a small pullback. Price is at 9,102, just above its VWAP at 9059. RSI at 61 indicates steady bullish interest. Support is at 8,906 and resistance is at 9,212
Wall Street remains bullish but is now in a corrective phase. Price has dropped to 43,786, below its VWAP of 44,407. The RSI of 43 highlights growing downside pressure. Support is at 43,580, and resistance is at 45,253.
Brent Crude continues in a choppy range, albeit with lower volatility, trading at 6,932, right at its VWAP. The RSI at 50 confirms the lack of directional bias. Support sits at 6,631 and resistance at 7,198.
Gold continues to consolidate in a broad triangle pattern - keeping it in a neutral range, with price at 3,357, nearly equal to its VWAP. The RSI at 53 shows a balanced outlook. Support is at 3,280 and resistance at 3,416.
EUR/USD holds a bullish trend but is correcting. The pair trades at 1.1565, slightly below the VWAP of 1.1635. RSI at 45 reflects subdued buying pressure. Support is at 1.1435 and resistance at 1.1834.
GBP/USD has potentially entered a new bearish trend in a quick reversal from the prior uptrend. It trades at 1.3275, below the VWAP of 1.3404. The RSI of 36 signals fresh bearish momentum. Support is at 1.3204 and resistance at 1.3604.
USD/JPY remains neutral and in a range phase but is possibly building a new uptrend with its recent drop back from range resistance. Price is 147.95, aligned with the VWAP. RSI at 53 suggests a balanced tone. Support is near 145.95 and resistance stands at 149.88.
Dax short medium termBearish till 21.800 which is an important retest. SL on a daily close above 24.000
