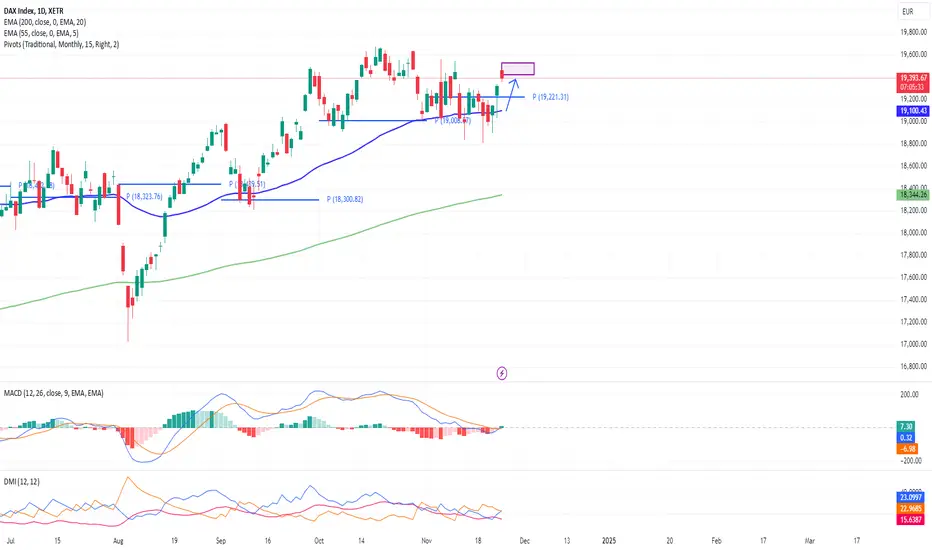
#202448 - priceactiontds - weekly update - dax Good Evening and I hope you are well.
tl;dr
dax xetra: Max bullish. Clear break above and dax printed 19600 again. New ath next week is likely just a matter of when. Targets above are 20000, That’s it. For bears it’s anything below 19130 but that is far away and very low probability. If November closes above 19600, I think 20k is almost a given. After that I will not care about bullish targets any more until we corrected at least 30%. Does not mean I won’t continue scalping it both ways.
Quote from last week:
comment: Thursday and Friday changed the character of the market. Bulls broke above the bear trend line and closed both days at the highs. Next target is the last bear trend line around 19430 before we can retest 19600+. Can only be bullish after past 2 days. Bears can only change my mind if they can close below 19100 again. For now I think many bears gave up and try again around 19500/19600. Is this structure very bullish? Absolutely not. I just think a retest of 19600+ is more likely than a close below 19100. The market spend enough time ins this trading range that the next push above could be the last before we correct in a bigger fashion. After this push up, I would not look for bullish targets until we have seen 18000. Market is overdue for a correction. We will see at least 16000 in 2025.
comment : Late bull breakout during the week like the week before that. Another clear buying signal going into next week. There is not much to add from my tl;dr. Both of my upper bull trend lines run through 20k and I have multiple measured move targets there. More than enough reasons to be bullish and look for longs. Bears can do almost nothing to change my mind, unless we see on giant bear bar closing below 19100 on Monday.
current market cycle: trading range but if we make higher highs, we are obviously in a continuation of the bull trend.
key levels: 19100 - 20000
bull case: Bulls want 20000. Clear as day, as is the breakout. My chart is clear and my invalidation levels are too.
Invalidation is a daily close below 19100.
bear case: Not much for the bears until they close below 19100 again. Did not change that sentence since past Sunday. Bears will dominate 2025 but now is not the time to be early as a bear.
Invalidation is above 20100.
outlook last week:
short term: Very bullish above 19400 and even more above 19600. Below 19100 we are absolutely neutral once again. Hell below 18800.
→ Last Sunday we traded 19322 and now we are at 19626. 300 points on the week, hope you made some.
short term : Max bullish for 20k. Can we chop some before we get there? Sure but I don’t think bears can get this below 19300 again before we hit 20k.
medium-long term - Update from 2024-10-19: 20000 is the goal for 2024, if bulls do not get it until year end, it will probably not happen for the next 5-10 years. This market is beyond overvalued and will drop 30-50% in the next 5 years. I have no doubts about that. That fact should not be relevant to your trading at all for now. The current push is most likely the last of it. Bears will come back soon.
current swing trade: None
chart update: Highlighted bull trend lines and my 5-wave series is still valid.
GER30 trade ideas

Insights Beyond the DAXWhen observing the DAX INDEX XETR:DAX on a weekly timeframe, identifying a clear pattern is challenging. However, check out the TEC DAX XETR:TDXP , which is closely correlated. You'll notice a clear bullish flag pattern forming, and we're nearing its upper band. Once this pattern activates, expect an upward surge for both indices. The bull market is still very much alive!


DAX - TIME HAS COMEI hope you all remember yesterday, when we said only hit our price then we short.
PATIENCE is the key.
but now we are prepare to SHORT once the price is hit our limit order at 19469-18482
STOP LOSS can be set at 19525 - can extend to 19575 depend on your risk
Target 1 at 19433-28 - once it hit, take some partial and bring stop loss to BE to protect the trade
target 2 at 19389-72
target 3 at 19367-48

DAX Countertrend BreakHello Traders,
I'm a purely technical trader, so I skip the fundamental analysis. If you can and even want, you can add some fundamental views in the comments.
From the technical point, every major timeframe shows a bullish trend now and the daily countertrend is broken, so the target zone is marked by the fibo area.
Would you buy or sell here?
Best,
Zen

DAX/GER - PREPARE FOR THE BATTLETeam, earlier we went long for scalping only.
but now we are prepare to SHORT once the price is hit our limit order at 19469-18482
STOP LOSS can be set at 19525 - can extend to 19575 depend on your risk
Target 1 at 19433-28 - once it hit, take some partial and bring stop loss to BE to protect the trade
target 2 at 19389-72
target 3 at 19367-48
NOTE: NO rush of an entry, until the price is reach. enter slowly with proper risk management.

Trendline BreakThe price has broken out of the trendline and retested the trendline, after the pullback we expect a bearish impulse.
On another note, we also see a similar move on the EUR50 and SPAIN35, which is more confluences
WE ONLY TRADE PULLBACKS

Ger40 Sell Limit OrderHi everyone. As we're in a pull back, I think this area has its potential to set an order to go short.
Entry:19290.6
SL: 19342.5
TP1: 19237(1:1RR)
TP2: 19185.5(1:2RR)
Lets see what happens...

1-hr DAX40: Strong Downward Momentum in German Stocks
The DAX40, Germany's leading stock index, is currently under heavy selling pressure. This bearish momentum is reinforced by the appearance of a Death Cross—a key technical indicator where a shorter-term moving average (MA) crosses below a longer-term MA, signaling strong selling activity. Recently, the RSI dropped into oversold territory, prompting a corrective bounce as buyers took advantage of lower prices. This pullback may continue toward 19,340, coinciding with the crucial 61.8% Fibonacci retracement level. If this resistance holds, it could attract sellers aiming to capitalize on the prevailing downtrend, offering favorable risk-to-reward opportunities.

GER40 Trade LogYour GER40 trade setup on the 1-hour timeframe demonstrates a robust approach when aligning technical indicators with your FVG strategy. Here's a detailed breakdown:
1. Risk-reward ratio (RRR):
The setup has a favorable 1:2 RRR, meaning for every 1% risk taken on the trade, you aim for a 2% return. Points-wise, the stop-loss is placed at 75 points, while the take-profit target is at 150 points.
2. Risk management:
You are risking 1% of your account per trade, which ensures proper risk control while aiming for a 2% profit, aligning well with professional trading standards.
3. Confluence with Ichimoku lines:
The inclusion of Ichimoku lines as part of the analysis adds an extra layer of confirmation. These lines can highlight areas of support and resistance, momentum, and trend direction. Their alignment with the FVG and trend suggests higher probability for success.
4. Strong trend:
Trading in the direction of a strong prevailing trend increases the likelihood of reaching the profit target. This confluence supports the trade thesis, minimizing the risk of adverse market moves.
5. Execution:
The entry point within the FVG, supported by Ichimoku signals, should ideally occur when price demonstrates confirmation, such as bullish candlestick patterns or other reliable triggers.
This setup combines high-probability technical elements with sound risk management, making it a structured and disciplined trade plan. Monitoring market conditions and economic events will be essential to manage any unexpected volatility.

Retest of previous highsThe Dax was on a bearish move targeting the 18700-18400 regions but is currently reversing and seems headed to touch previous resistance barriers. The bullish possibility is because price action failed to go beyond the 18800, settling around the 18900 and now 19000 instead. As long as the price is above 19k, the index may try to touch the 19420 and 19500 zones.

Potential bullish rise?DAX40 (DE40) has reacted off the pivot which acts as a pullback support and could potentially rise to the 1st resistance level which is also a pullback resistance.
Pivot: 19,288.06
1st Support: 19,143.10
1st Resistance: 19,487.60
Risk Warning:
Trading Forex and CFDs carries a high level of risk to your capital and you should only trade with money you can afford to lose. Trading Forex and CFDs may not be suitable for all investors, so please ensure that you fully understand the risks involved and seek independent advice if necessary.
Disclaimer:
The above opinions given constitute general market commentary, and do not constitute the opinion or advice of IC Markets or any form of personal or investment advice.
Any opinions, news, research, analyses, prices, other information, or links to third-party sites contained on this website are provided on an "as-is" basis, are intended only to be informative, is not an advice nor a recommendation, nor research, or a record of our trading prices, or an offer of, or solicitation for a transaction in any financial instrument and thus should not be treated as such. The information provided does not involve any specific investment objectives, financial situation and needs of any specific person who may receive it. Please be aware, that past performance is not a reliable indicator of future performance and/or results. Past Performance or Forward-looking scenarios based upon the reasonable beliefs of the third-party provider are not a guarantee of future performance. Actual results may differ materially from those anticipated in forward-looking or past performance statements. IC Markets makes no representation or warranty and assumes no liability as to the accuracy or completeness of the information provided, nor any loss arising from any investment based on a recommendation, forecast or any information supplied by any third-party.

GER30 H4 I Bounce off an overlap support?Based on the H4 chart analysis, we can see that the price is falling to our buy entry at 19,203.85, which is an overlap support close to 38.2% Fibo retracemet.
Our take profit will be at 19,440.78, a multi-swing high resistance.
The stop loss will be placed at 18,986.33, which is a multi swing low support level.
High Risk Investment Warning
Trading Forex/CFDs on margin carries a high level of risk and may not be suitable for all investors. Leverage can work against you.
Stratos Markets Limited (www.fxcm.com):
CFDs are complex instruments and come with a high risk of losing money rapidly due to leverage. 64% of retail investor accounts lose money when trading CFDs with this provider. You should consider whether you understand how CFDs work and whether you can afford to take the high risk of losing your money.
Stratos Europe Ltd, previously FXCM EU Ltd (www.fxcm.com):
CFDs are complex instruments and come with a high risk of losing money rapidly due to leverage. 66% of retail investor accounts lose money when trading CFDs with this provider. You should consider whether you understand how CFDs work and whether you can afford to take the high risk of losing your money.
Stratos Trading Pty. Limited (www.fxcm.com):
Trading FX/CFDs carries significant risks. FXCM AU (AFSL 309763), please read the Financial Services Guide, Product Disclosure Statement, Target Market Determination and Terms of Business at www.fxcm.com
Stratos Global LLC (www.fxcm.com):
Losses can exceed deposits.
Please be advised that the information presented on TradingView is provided to FXCM (‘Company’, ‘we’) by a third-party provider (‘TFA Global Pte Ltd’). Please be reminded that you are solely responsible for the trading decisions on your account. There is a very high degree of risk involved in trading. Any information and/or content is intended entirely for research, educational and informational purposes only and does not constitute investment or consultation advice or investment strategy. The information is not tailored to the investment needs of any specific person and therefore does not involve a consideration of any of the investment objectives, financial situation or needs of any viewer that may receive it. Kindly also note that past performance is not a reliable indicator of future results. Actual results may differ materially from those anticipated in forward-looking or past performance statements. We assume no liability as to the accuracy or completeness of any of the information and/or content provided herein and the Company cannot be held responsible for any omission, mistake nor for any loss or damage including without limitation to any loss of profit which may arise from reliance on any information supplied by TFA Global Pte Ltd.
The speaker(s) is neither an employee, agent nor representative of FXCM and is therefore acting independently. The opinions given are their own, constitute general market commentary, and do not constitute the opinion or advice of FXCM or any form of personal or investment advice. FXCM neither endorses nor guarantees offerings of third party speakers, nor is FXCM responsible for the content, veracity or opinions of third-party speakers, presenters or participants.

Bearish Breakdown Brewing on GER30 – Watch for the Drop!The price action shows a weak uptrend, with lower momentum reflected in the narrow candles nearing resistance.
The red trendline highlights the fragile support beneath the recent structure.
A break below the trendline signals bearish pressure gaining control.
If confirmed, the price is likely to revisit the key demand zone around the red horizontal line at 19,028.77, a major support level from prior lows.

DAX Buy SetupHi everyone.
As we have BOS in 1H TF and even an opening market gap, So I think for the next pullback we'll come to this area to fill the gap and also touch the demand zone and then go up again.
That's what I think about DAX.
Let's see what happens...

Weekly Technical AnalysisStart your week by identifying the key price levels and trends.
The SpreadEx Research team has analysed the most popular markets, including stocks, indices, commodities & forex.
*KEY
Trend is set by the slope of the VWAP over 50 periods
Phase is determined by the current price relative to the VWAP (20) level (above or below)
Support & Resistance are set by the StdDev #2 Lower and Upper respectively.
Momentum is determined by the RSI level (70 as overbought and under 30 as oversold).
Analysis
---------------------------------------------------------------------------------------------------------------------
Germany 40 remains bullish but is in a correction phase, trading at 19,408, now comfortably above the VWAP (20) level of 19,168. Support is at 18,903, with resistance at 19,410. The RSI is at 55, indicating moderate momentum, suggesting the index is stabilizing within its uptrend.
UK 100 index holds a neutral trend in a consolidation phase, however recent action has been decidedly bullish with the price at 8,295, easily above the VWAP (20) of 8,125. Support is positioned at 7,966, with resistance at 8,290. An RSI of 64 reflects much stronger momentum cs last week, with renewed potential for an upside breakout.
Wall Street remains bullish and is in an impulsive phase, trading at record highs of 44,587, well above the VWAP (20) of 43,460. Support is at 41,908, while resistance is positioned at 45,013. The RSI at 69 signals strong bullish momentum, nearing overbought territory as is to be expected in a strongly bullish environment.
Brent Crude is neutral in a consolidation phase, trading at 7408, having bounced off major support at 70 again, slightly above the VWAP (20) of 7335. Support is at 7037, with resistance at 7,633. The RSI at 52 reflects the range-bound conditions, with no clear directional bias.
Gold remains bullish but is in a correction phase after a quick rebound from a steep correction - now trading at 2,674, back above the VWAP (20) of 2,655. Support is positioned at 2,533, with resistance at 2,777. The RSI at 51 indicates neutral momentum as the metal consolidates within its broader uptrend.
EUR/USD remains distinctly bearish - having not crossed adobe the VWAP in 2 weeks. The price at 1.0486 is still below the VWAP (20) of 1.0641. Support is at 1.0343, with resistance at 1.0939. The RSI at 34 signals continued bearish momentum but the rebound from more oversold conditions indicates a possible retracement soon.
GBP/USD has shifted to a bearish impulsive trend, trading at 1.2574, easily below the VWAP (20) of 1.2765. Support is at 1.2439, with resistance at 1.3091. The RSI at 33 reflects increasing bearish momentum, suggesting potential for further declines unless support holds.
USD/JPY remains bullish in a correction phase, trading at 154.44, slightly above the VWAP (20) of 153.20 but below former highs. Support is at 151.43, with resistance at 156.41. The RSI at 55 reflects continued bullish momentum, with room to advance further before approaching overbought levels.

DAX**DAX:**
This week's forecast is for the price to rise slightly to the area between 19408.15 and 19519.67.
GER30 Eyes Key Resistance at 19,513Hello,
FX:GER30 is currently testing the strong 1M resistance at 19,513.3995. If this level flips into support, it could pave the way for further upside movement. Conversely, if it holds firmly as resistance, a downside move is likely. However, all indications currently point toward a potential upward trend. The outcome will become clearer following the resistance test.
No Nonsense. Just Really Good Market Insights. Leave a Boost
TradeWithTheTrend3344

#202447 - priceactiontds - weekly update - dax Good Evening and I hope you are well.
tl;dr
dax xetra: Bullish if we get above 19400 and have a daily close there on Monday. Neutral otherwise. Bullish bias was correct last week and bulls broke above the bear trend line. They have made higher highs and lows and are in control again. I have many blow-off top targets above for all markets and if bulls get follow through next week, chances are very good that we reach them before we see a bigger correction. Bears can only hope to keep it below 19400 or we see 19500 soon. Below 18800 I don’t think bulls can reverse this again and we would drop down to 18500.
Quote from last week:
comment : Another week where I can’t make up new stuff. Bears dipped below 19000 and again but could not close below it even once. Market is in balance around 19200-19300 and until we have a daily close below 19000 or above 19400, we will continue to oscillate around that range. It’s maybe slightly more bearish because we have closed 4 consecutive days below the daily 20ema.
comment : Thursday and Friday changed the character of the market. Bulls broke above the bear trend line and closed both days at the highs. Next target is the last bear trend line around 19430 before we can retest 19600+. Can only be bullish after past 2 days. Bears can only change my mind if they can close below 19100 again. For now I think many bears gave up and try again around 19500/19600. Is this structure very bullish? Absolutely not. I just think a retest of 19600+ is more likely than a close below 19100. The market spend enough time ins this trading range that the next push above could be the last before we correct in a bigger fashion. After this push up, I would not look for bullish targets until we have seen 18000. Market is overdue for a correction. We will see at least 16000 in 2025.
current market cycle: trading range
key levels: 18800 - 20000
bull case: Bulls next target is 19400+ before retest of ath. My most outrageous bullish target is still 20000 and everything is aligned to get there. If bulls can’t get it now, they probably wont get it for years.
Invalidation is a daily close below 19000.
bear case: Not much for the bears until they close below 19100 again. They tried for more than two weeks with going nowhere and now market tries the other direction again. I expect more bears to come around at 19600 and if they won’t hold, 20000. Most likely outcome is a continuation of the trading range 18800 - 19600.
Invalidation is above 19600.
outlook last week:
short term: Neutral 19000 - 19300, bullish above for 19600 or higher. Daily close below 19000 is worst case for bulls because there is no more support until 18200.
→ Last Sunday we traded 19210 and now we are at 19322 . 90 points on the week. Who told you it’s neutral inside given range? You are goddamn right.
short term: Very bullish above 19400 and even more above 19600. Below 19100 we are absolutely neutral once again. Hell below 18800.
medium-long term - Update from 2024-10-19: 20000 is the goal for 2024, if bulls do not get it until year end, it will probably not happen for the next 5-10 years. This market is beyond overvalued and will drop 30-50% in the next 5 years. I have no doubts about that. That fact should not be relevant to your trading at all for now. The current push is most likely the last of it. Bears will come back soon.
current swing trade : None
chart update: Bull flag still valid but potential bullish 5-wave series added for 20k.

MY APPROACH TO MAKING MONEYMy main trading principle is that the price always moves from swept liquidity levels to untouched liquidity levels by forming structure on the way.
Liquidity and Structure is a key for my trading system.


Ipotesi cambio rotta dax sempre più concretaAttendo ritracciamento per posizionarmi long su dax.
mib segue a fotocopia

2024-11-21 - priceactiontds - daily update - dax Good Evening and I hope you are well.
tl;dr
dax xetra - Bullish. 3 times bears tried to close below 19000 and failed. Today bears only printed a higher low and the chances for the bulls are good to get above 19260, test 19360 and then melt above to 19600+. If my thesis is correct, market will not drop much again overnight or tomorrow. Anything below 19140ish is probably invalidation for that. If bears do it again, also a decent chance that bulls give up and we finally see a bigger down move but for now I heavily favor the bulls.
comment : Will get a bit whacky now but bear with me. I do think today was W1 of a 5-wave series where W3 will lead to 19450ish and the bear trend line and W5 will lead to 20k because a measured move up from my W3 is almost exactly 20k. So if that will happen, you are welcome. I think the current structure is a simply if this then that case. Market stays above 19000, we will likely break above 19200 for 19450 and so forth. If we print below 19000 again, bulls might give up and we flush down in a bigger move. One side has to give tomorrow and I heavily favor the bulls.
current market cycle: trading range
key levels: 18800 - 20000
bull case: Bulls closed above the first bear trend line and it was another huge reversal day. Bears tried 3 times and it’s time to give up and find more sellers at higher prices. It’s entirely possible that this market will trade between 18800 and 19300 for the next year. Always be open to many possible outcomes.
Invalidation is below 18869.
bear case : Bears still see the trend line as not broken enough and they are still printing lower highs and as long as that is the case, they have made money selling highs and they will continue to do so. Problem for the bears is the higher low from today and that the market closed at the highs. If they manage to get below 19000 again, their odds rise and it’s possible that more bulls give up and we see a bigger move down.
Invalidation is above 19310..
short term: Bullish. Want to see 19300 and maybe 19400+ tomorrow. Everything below 19000 means I’m wrong and we either chop until world ends or flush down.
medium-long term - Update from 2024-10-19: 20000 is the goal for 2024, if bulls do not get it until year end, it will probably not happen for the next 5-10 years. This market is beyond overvalued and will drop 30-50% in the next 5 years. I have no doubts about that. That fact should not be relevant to your trading at all.
current swing trade: None
trade of the day: Very risky longs around 19000 with a wide stop below y low but they paid.
