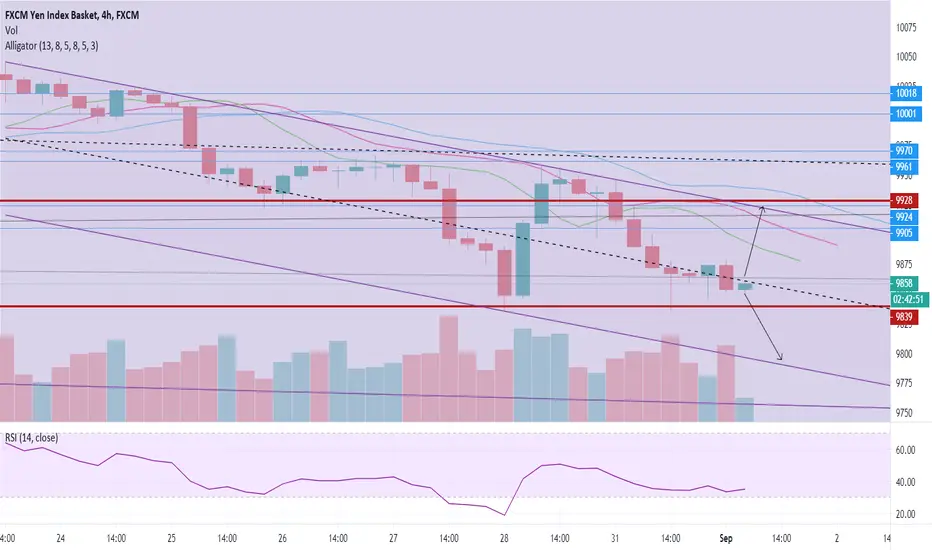
JPYBASKET SellBreak lows corrective test confirmation to anticipated direction take your bag of pips Home
JPYBASKET trade ideas


EDUCATION - SPECIAL INDICATORS Hello traders,
Today i am highlighting how to effectively use JPYBASKET and DXY when using technical analysis.
I hope you enjoy the content, if so please like and follow the channel.
Comment below with any questions you may have.
Safe trading.

JPY INDEXJPY index is never succeeded brek above bullish area zone
and close in Fri in the middle PIVOT POINT

JPYBASKET Daily Double Bottom DivergenceYen Index Showing signs of possible strength with Double Bottom on support along the RSI Divergence.
With this we can see all the JPY related pairs get impacted.
Wait and watch the day scenario....

JPY could continue to FALLhey tradomaniacs,
JPY is currently testing a very strong resistance-zone and could continue to fall 👉
If that`s the case and we see rising yields, we can consider to BUY EUR/JPY as US-DOLLAR is under pressure!


JPY Index Pre-Election Analysis JPY Index ended the week consolidating at the previous HH (10229).If this market can't break and close above this current level I'll be looking a minor pullback towards the 50% fibonacci for buys which has confluence with a previous level of daily minor resistance. A break and close below the previous HL (9999) will invalidate buy setups.


JPYDepending how the current 8HR and Daily finish
If it breaks the trend line and the top Horizontal Ray I will be Bullish.
If it respects the trend line and goes to break the lower Horizontal Ray I will be Bearish.

JPY Index Analysis This market is still in the pullback phase. Waiting to see what this market does at the 50% fib level


JPY Index Bullish Market StructureThe JPY index has made a new HH. I'll be expecting a pullback towards the previously broken high

Canary in the coalmine!JPY basket is at a critical junction point following touch of descending trendline from March.
Will the Bull charge cause the JPY to breakdown next week?
Or will the Bears push it higher still?

Will it break support today?Yen still looking vulnerable. It's a bull market you know!
As always though it could go either way, always plan for either event and react accordingly!
JPY looking vulnerable...JPY basket of currencies is close to falling through support, will it hold?
I don't think it will but it could go either way.... as with everything in Forex!


4H JPY LONGJapanese Yen can rise from here after breaking through this structure zone and forming a new higher low.
