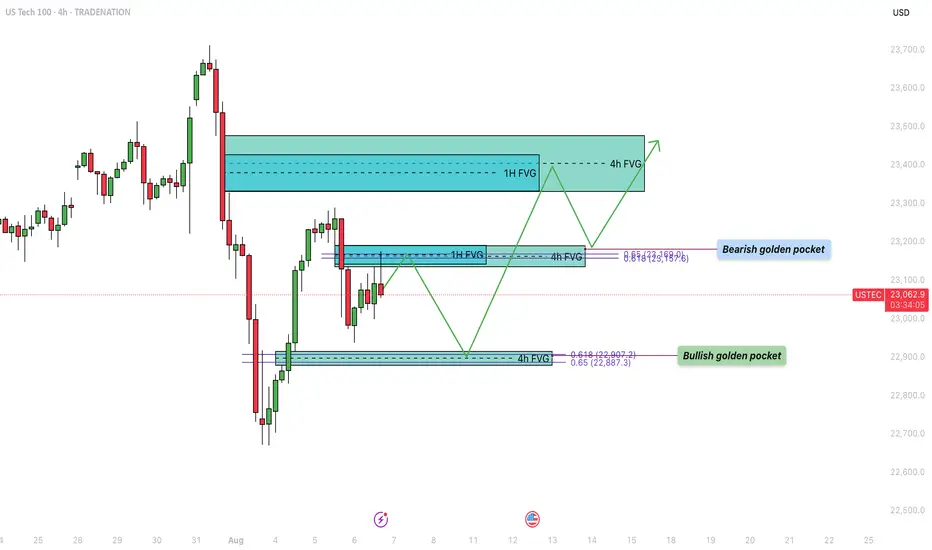
US100 - Bullish trajectory to fill the inbalance zones!Over the past week, the US Tech 100 (US100) experienced a sharp decline, dropping into a significant support zone. During this bearish move, several fair value gaps (FVGs) formed on both the 4-hour and 1-hour timeframes, which remain unfilled. Currently, price action is retracing upward, aiming to fill these imbalances. The structure of the market suggests that both bullish and bearish scenarios are in play, depending on how price reacts to key levels marked by these FVGs and Fibonacci retracement zones.
Bearish Resistance
The first major area of resistance is located around the $23,160 level, which has just been tapped. This zone presents a strong potential turning point due to the confluence of a 1-hour and a 4-hour fair value gap, which perfectly align with the 0.618–0.65 Fibonacci retracement level, also known as the golden pocket. This cluster of technical signals increases the probability that this level will act as a strong supply zone, potentially initiating a rejection back toward the lower support area.
Bullish Support
On the downside, a key level to watch is around $22,900. This zone marks a 4-hour FVG that was formed during the recent upward move. Importantly, this area also coincides with the golden pocket from that very same leg up, offering a compelling confluence for bullish support. If price revisits this level, it may act as a strong demand zone, providing a springboard for the next leg higher, particularly if buyers step in aggressively to defend it.
Bullish Trajectory
If support at $22,900 holds, the bullish trajectory suggests a possible continuation toward the $23,400 region. This upper target contains a large overlapping 1-hour and 4-hour FVG that remains unfilled. Historically, price tends to revisit and fill such imbalances before choosing a definitive direction. A bounce from the lower support zone and a successful break of the $23,160 resistance could pave the way for a clean move toward this higher target, completing the FVG fill sequence.
Final Thoughts
The US100 is currently navigating a key technical crossroads. With multiple unfilled fair value gaps and well-aligned Fibonacci levels on both the upside and downside, the next few sessions will be critical in determining short-term direction. If the $23,160 resistance continues to hold, a pullback to $22,900 could offer a high-probability long setup, while a clean break above this resistance opens the door to filling the higher FVGs.
-------------------------
Disclosure: I am part of Trade Nation's Influencer program and receive a monthly fee for using their TradingView charts in my analysis.
Thanks for your support. If you enjoyed this analysis, make sure to follow me so you don't miss the next one. And if you found it helpful, feel free to drop a like 👍 and leave a comment 💬, I’d love to hear your thoughts!
NAS100 trade ideas
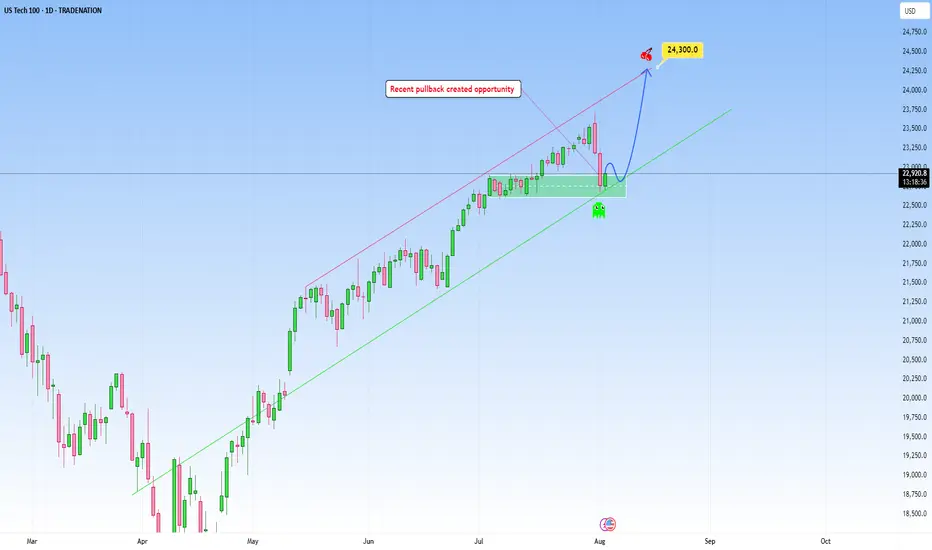
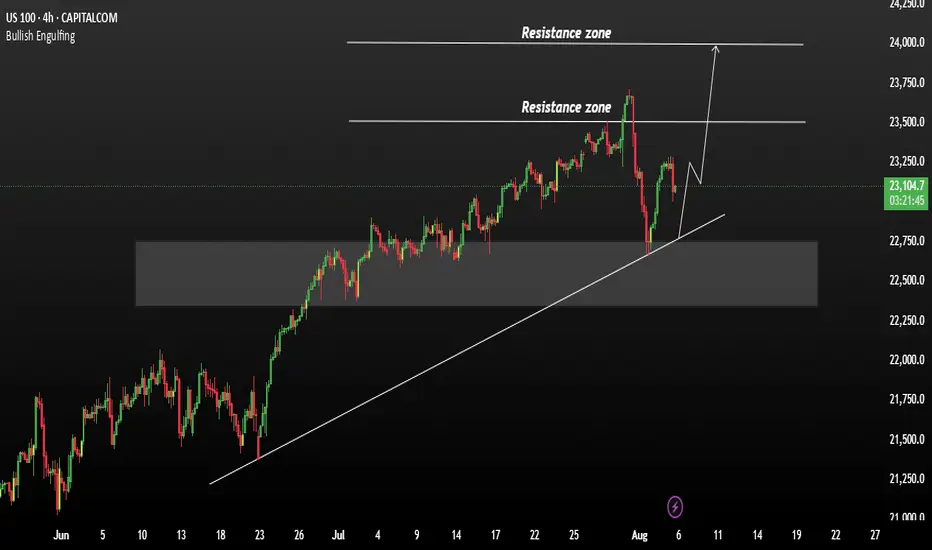
USTEC: Likely continuation following pullbackNAS100 climbed a steep uptrend and my expectation is for a continuation as marked on my chart, with an upside target at around 24,300.
This area here is where it can become a decision point, either price finds support and bounces, or it breaks below, and that’s when we might see the move start to extend lower.
If I were to take a side here, I would definitely choose more upside, but again only price action should determine next move.
But if price breaks below the trendline with conviction, it would invalidate the bullish scenario, suggesting that the uptrend may pause or could even reverse short-term.
Just sharing my thoughts for the charts, this isn’t financial advice. Always confirm your setups and manage your risk properly.
Disclosure: I am part of Trade Nation's Influencer program and receive a monthly fee for using their TradingView charts in my analysis.
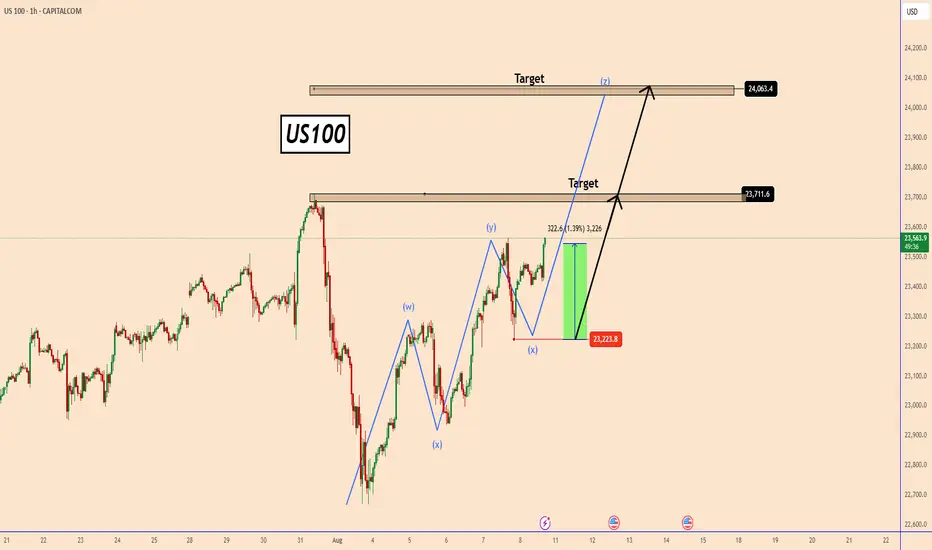
US100 Builds Momentum Toward New HighsUS100 Builds Momentum Toward New Highs
Since yesterday, the US100 has climbed by nearly 1.4%, rising from 23,223 to 23,550.
The bullish trend is strong, and it looks like US100 is preparing for a bigger upward move—possibly aiming to set a new all-time high.
Before continuing higher, US100 may first test the top of the current structure near 23,710, and then push toward 24,000.
The rally comes after weaker-than-expected NFP data, which has increased expectations for a 25 basis point rate cut by the Fed in September.
J.P. Morgan now forecasts a 25 bps rate cut, citing signs of a slowing labor market and uncertainty surrounding President Donald Trump's latest Fed nomination.
You may find more details in the chart!
Thank you and Good Luck!
PS: Please support with a like or comment if you find this analysis useful for your trading day
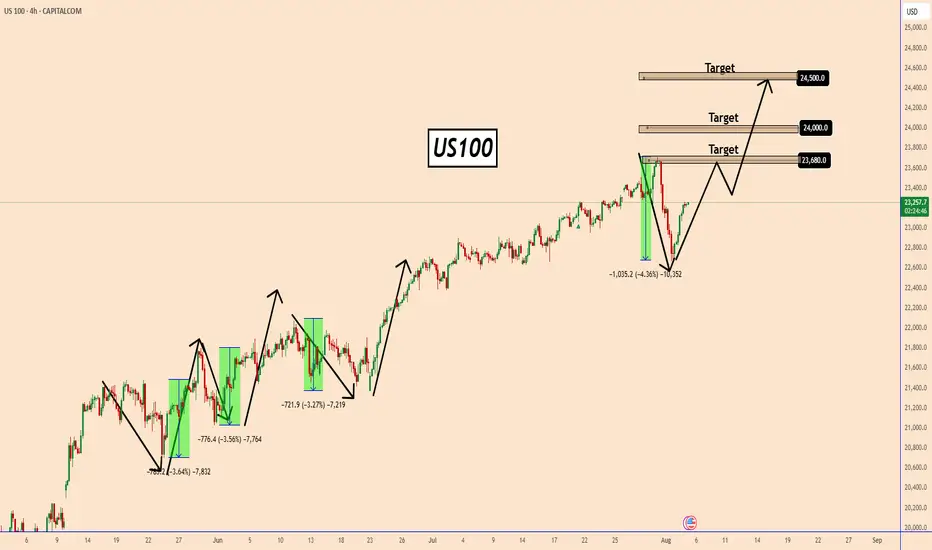
US100 Technically Move Up HeadThe US100 has seen multiple pullbacks of around 3.5% to 4% over the past week. However, each dip has been met with strong buying interest, leading to quick recoveries — indicating that these were bullish pullbacks, not trend reversals.
This kind of price action typically reflects underlying market strength, where investors view corrections as buying opportunities rather than signals of weakness.
Key Technical Observations:
Each drop has been bought aggressively, suggesting a firm support base in the 22,700–23,000 region If this bullish momentum persists, US100 could retest recent highs and potentially break through, opening the path towards 23,500 and 2: 24,500
You May find more details in the chart.
Trade wisely best of Luck Buddies.
Ps: Support with like and comments for better analysis Thanks for understating.
NASDAQ Potential UpsidesHey Traders, in today's trading session we are monitoring NAS100 for a buying opportunity around 23,300 zone, NASDAQ is trading in an uptrend and currently is in a correction phase in which it is approaching the trend at 23,300 support and resistance area.
Trade safe, Joe.

US100 Price Action InsightUS100 Price Action Insight
In recent analysis, we’ve seen the US100 drop multiple times last month by around 3.5% to 4%, but each time it quickly bounced back, showing that these moves were simply buying opportunities during deep pullbacks.
This time, the index fell by about 4.3% due to fears over new tariffs on August 1st, but it's already recovering, which suggests that the bullish trend remains intact.
If momentum continues, US100 could retest the highs near 23,680, and potentially break above to 24,000 or even 24,500.
You may find more details in the chart!
Thank you and Good Luck!
PS: Please support with a like or comment if you find this analysis useful for your trading day
USNAS100 Holds Bearish Below 23045USNAS100 – Overview
The index maintains a bearish momentum as long as it trades below the pivot zone between 22990 and 23045.
To confirm a bullish reversal, the price must break above 23045 and close a 1H candle above it.
On the downside, a break below 22875 would reinforce bearish pressure, opening the path toward the next support at 22720.
Support: 22875 • 22720
Resistance: 23150 • 23295
Bias:
🔻 Bearish below 23045
🔺 Bullish only with a confirmed 1H close above 23045

Nasdaq 100: Institutional Move Toward 22,680 Unfolding📊 Nasdaq 100 Smart Money Breakdown
Current Price: 22,103
Target Price: 22,680
🔼 Upside Potential: +577 points
The market is currently positioned for a premium retracement move after a recent liquidity sweep below short-term equal lows, which likely triggered sell-side liquidity. This setup hints at Smart Money Accumulation, with institutions entering long positions at discount pricing.
We're now seeing:
✅ Break of Structure (BOS) to the Downside
✅ Internal liquidity sweep
✅ Price reacting from a discounted OB (Order Block)
✅ Potential drive toward the next liquidity pool sitting above the 22,680 level.
This move aligns with a bullish market structure shift, suggesting Smart Money is engineering price higher to target buy-side liquidity above recent highs.
🎯 Target: 22,680 – a key liquidity area where Smart Money may look to offload positions.

NASDAQ technical analyse.📉 NAS100 Technical Analysis – Potential Reversal Zone Identified (4H Chart)
Price has seen a strong bearish move, breaking through multiple support levels. Currently, it is approaching a key demand zone between 22,600 – 22,420, which previously acted as strong support in early July.
I'm watching two potential scenarios from this level:
🔹 Scenario A (Blue Path): A bullish reversal from the current zone, targeting the 23,400 area. This would require confirmation with bullish candlestick patterns or momentum divergence.
🔸 Scenario B (Red Path): A deeper dip into the demand zone (towards 22,420), followed by a stronger bounce. This could offer a better risk-to-reward long entry if bullish structure forms.
🔻 Invalid if price closes decisively below 22,400, breaking structure and invalidating the reversal setup.
Let me know your thoughts. Are you going long or still waiting for confirmation?

Nasdaq bull flag forming with a sweet entry.I think we've got a bull flag forming on the hourly on the NASDAQ. I think we need to take out this wick. And I think we come down and take out these stops just above where the red box is. And I think that's a pretty sweet entry before we go to new all-time highs. Um, let's see what happens. Hope you guys can follow.

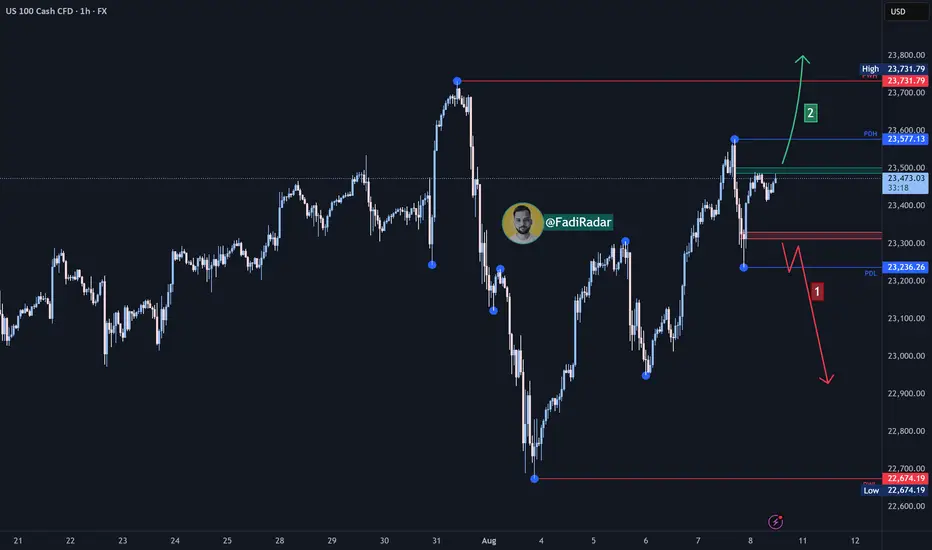
NASDAQ Index (US100 / NASDAQ) Analysis:The NASDAQ index has shown strong bullish momentum recently and is currently trading near a key resistance level at $23,500.
🔻 Bearish Scenario:
If the price fails to break above $23,500 and selling pressure emerges, we could see a downward correction toward $23,310. A break below this level could extend the decline toward $23,000.
🔺 Bullish Scenario:
If the price successfully breaks and holds above $23,500, it could support further upside toward $23,600 as the first target. With continued bullish momentum, the price might reach $23,750.
⚠️ Disclaimer:
This analysis is not financial advice. It is recommended to monitor the markets and carefully analyze the data before making any investment decisions.
NAS100 - Higher Right FootDear Friends in Trading,
How I see it,
Outcome = "VERY STRONG BULLISH STRUCTURE"
Price retraced back into discount and formed a higher right foot.
Keynote:
1)This means if the current resistance area is breached decisively,
The potential for new HH's and/or new ATH's in this case is very high
2) If resistance offer multiple higher TF rejections the structure can fail.
In this case I feel it is the less likely outcome
I sincerely hope my point of view offers a valued insight
Thank you for taking the time study my analysis.

NASDAQ price dropAfter the Nasdaq price reaches around 23642.2, a historic drop will occur and the target is to drop to 16308.
Whatever happens at the highest price, the final destination is towards 16308.
I have identified the price levels in the middle of this expected drop that can cause the price to correct.
IG:NASDAQ

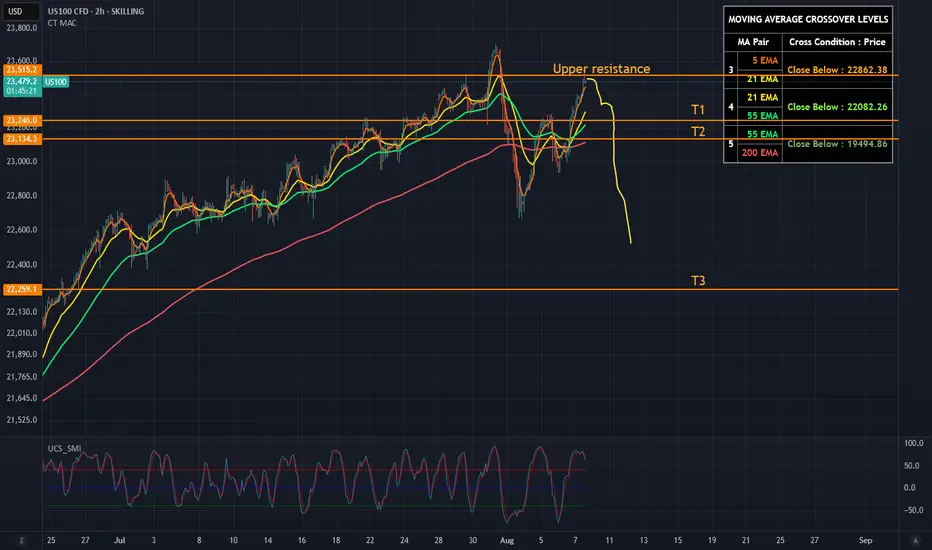
US100: Near All Time Highs, Weak FoundationThe Nasdaq 100 (US100) is hovering near all-time highs (~23,500), but signs of exhaustion are mounting. Momentum is fading, RSI is overstretched, and volume has been declining - all classic symptoms of a tired rally.
From a technical perspective, the index is pressing against upper trendline resistance after an aggressive multi-week run. Price action shows weakening follow-through on each new high, hinting at buyer fatigue. Best example was the huge sell-out last week.
Fundamentally, the rally is losing its foundation:
- Earnings surprises from Big Tech (Apple, Shopify) are already priced in.
- AI hype is cooling off, and valuation multiples remain extreme.
- Macro data (ISM Services, jobs) suggest economic softness.
- Fed rate cut hopes are baked in — any disappointment could trigger a sharp repricing.
Conclusion for me:
The Nasdaq looks ripe for a pullback.
We may possibly see a short spike above my drawn "upper resistance line" but I'm pretty convinced we won't see new ATH, - in my opinion it would be just a stop hunt.
If 23,000 then breaks, watch for acceleration toward 22,500 and beyond. The air is thin up here.
T1: 23250
T2: 23100
And if we get the break - I see T3 - 22250
One unpredictable variable, though? The world’s leaders.
Their "creative" decision-making has the power to nuke any technical setup.
Markets may follow charts and earnings - until a politician wakes up and chooses chaos.
No trading advice, just my ideas. :)
Nasdaq and S&P500 Short: A multi-factor analysisIn this long video, I go through why I think the equity markets are going to crash in August.
Here are the important points:
1. I talk about the stealth liquidity which is the reverse repo balance being drawn down and almost emptied.
2. The risk-off asset classes rising: Gold, Japanese Yen.
3. The risk-on asset classes falling: Nasdaq, Bitcoin, Ethereum.
Here's my outlook for the markets from now till September FOMC:
1. The equity markets, USDJPY, Bitcoin, and Ethereum will crash.
2. 3-month treasury yield will fall below 4.25% and even below 4%.
3. Fed will cut target rates to be within the 3-month treasury yield.
As usual, good luck in your trading and keep your risks tight!


Top in Place? NASDAQ100 Signals Exhaustion After Incredible Run📈 The crazy run since April
NASDAQ100 has had a spectacular run since early April, when the index dipped to 16,300 amid rising tensions caused by Trump’s tax war. From that low, we’ve seen a mind-blowing rally of over 7,000 points, which translates to a 40% gain in just 4 months.
Such a rise is not just impressive— it’s overextended , especially by historical standards. Markets don’t move in straight lines forever, and this one might be showing signs of fatigue.
🕯️ Bearish signal at the top
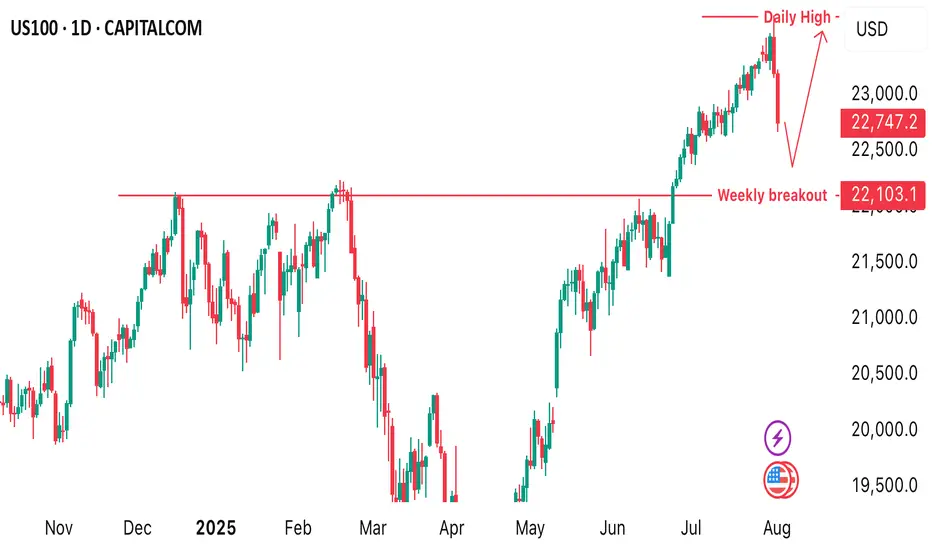
Fast forward to this week: yesterday, the index marked a new all-time high at 23,700, but closed the day with a strong bearish engulfing candle — one that wipes out the gains of the previous 4 trading sessions.
This is not a small technical detail. Such candles, when appearing after an extended rally, often signal exhaustion and a potential shift in momentum.
❗ Top in place?
In my opinion, there's a high probability that a top has been set, at least temporarily. We might be looking at the beginning of a healthy correction, or even something more meaningful, depending on follow-through in the next sessions.
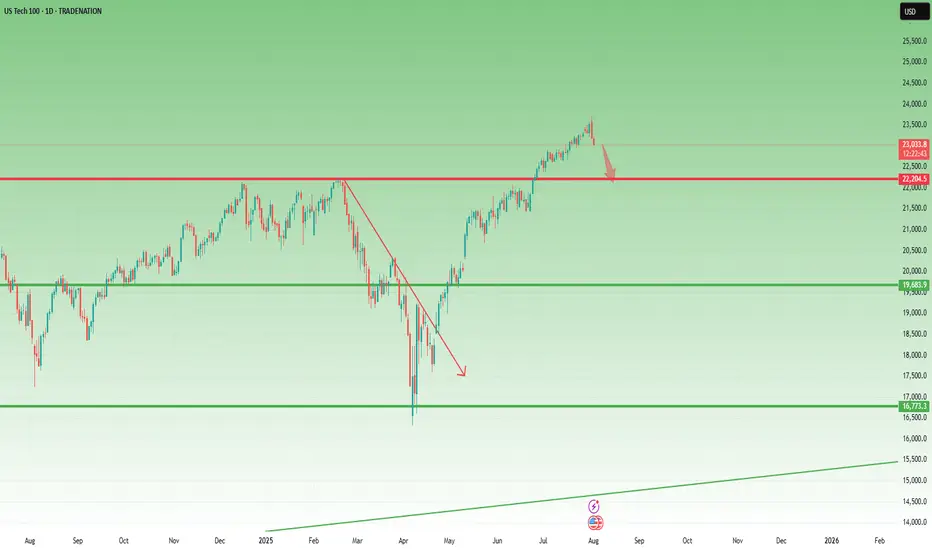
📉 Where to next?
The first major support to watch is the 22,200 level.
I expect that zone to be tested soon — and honestly, considering how much the index has gone up, this shouldn’t surprise anyone. It’s nothing more than a minor pullback, all things considered.
🧠 Stay smart!
When markets go vertical, it pays to stay disciplined and realistic. Tops rarely announce themselves, but when signals like this appear, it’s wise to listen.
Disclosure: I am part of TradeNation's Influencer program and receive a monthly fee for using their TradingView charts in my analyses and educational articles.
NAS100 LongElite Analysis
This analysis is not executable ONLY UNTIL we get a BOS on the 10m time frame.
(Potential BOS is identified on chart)
Once we get the BOS, we execute from the 10m OB.
Targeting upper liquidity pools.

NASDAQ Channel Up to be rejected soon.Nasdaq (NDX) has been trading within a Channel Up since the start of the month. The primary Support level has been the 4H MA50 (blue trend-line), which hasn't closed a 4H candle below it since July 14.
Right now the index is on its latest Bullish Leg, which can technically extend by +2.35% (max such Leg within the Channel Up).
We expect a rejection targeting the 4H MA50 again at 23200, which would represent a -1.25% decline, the weakest such Bearish Leg we had within the Channel Up.
-------------------------------------------------------------------------------
** Please LIKE 👍, FOLLOW ✅, SHARE 🙌 and COMMENT ✍ if you enjoy this idea! Also share your ideas and charts in the comments section below! This is best way to keep it relevant, support us, keep the content here free and allow the idea to reach as many people as possible. **
-------------------------------------------------------------------------------
Disclosure: I am part of Trade Nation's Influencer program and receive a monthly fee for using their TradingView charts in my analysis.
💸💸💸💸💸💸
👇 👇 👇 👇 👇 👇

NASDAQ INDEX (US100): Another Gap For Today?I anticipate another gap up opening on the 📉US100 Index, which I believe will be filled today.
The formation of an intraday bearish change of character(CHOCH) on the hourly chart
This indicates a strong likelihood of continued bearish movement, with a target of 23319.

US100 makes a slight drop from ATH!Price dropped from the all time high of 23,703 we’re beginning to see a pullback in price. We’d be monitoring a time price will shift from intraday bearish to bullish. This is to help us position ourselves for a buy opportunity.
Nasdaq: End of Bullish Wave, 10%+ Downside in Sight?Hey Realistic Traders!
Has CAPITALCOM:US100 (Nasdaq) Finally Peaked? A Reversal Signal Just Flashed. Is This the Turning Point Toward a Deeper Pullback?
Let’s dive into the technicals to see what the chart is really telling us.
Technical Analysis
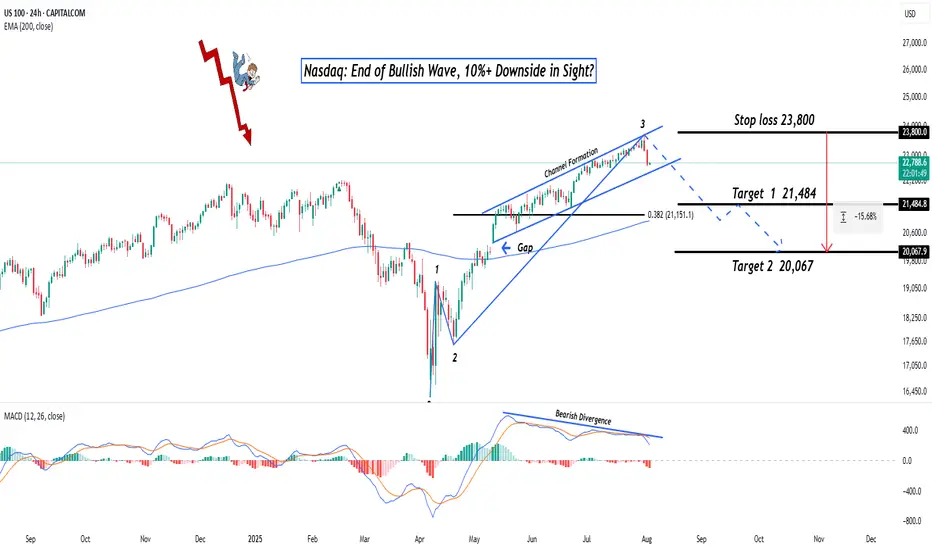
On the daily chart, the Nasdaq is starting to show signs of weakness. A bearish divergence has formed between the MACD and price movement , which is a classic signal that bullish momentum may be fading. This often indicates the potential for a trend reversal or a deeper correction.
A recent drop, confirmed by a strong bearish full-body candlestick, suggests that selling pressure is increasing. If this continues, we expect a breakdown from the current bullish channel.
In this scenario, the extended Wave 3 may have reached its peak. A correction could follow, with the first target at 21484, which lines up with the 0.382 Fibonacci retracement level. If the decline continues, the next downside target would be around 20067, where a previous gap may be filled.
This bearish outlook remains valid as long as the price stays below 23800 . A move above that level would invalidate the setup and return the outlook to neutral.
Support the channel by engaging with the content, using the rocket button, and sharing your opinions in the comments below.
Disclaimer: "Please note that this analysis is solely for educational purposes and should not be considered a recommendation to take a long or short position on Nasdaq.
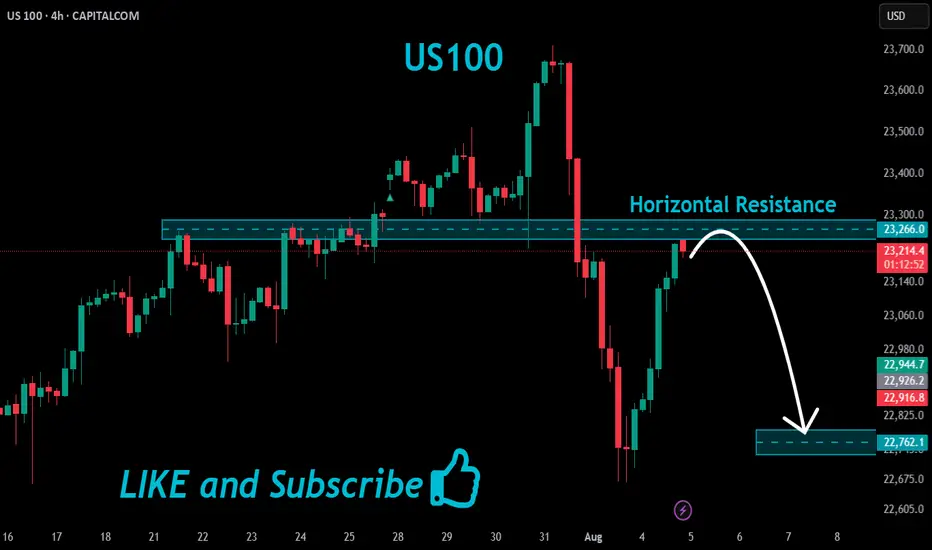
US100 Local Short!
HI,Traders !
#US100 made a retest
Of the horizontal resistance
Of 23266.0 and we are already
Seeing a bearish reaction and
We will be expecting a further
Bearish move down !
Comment and subscribe to help us grow !