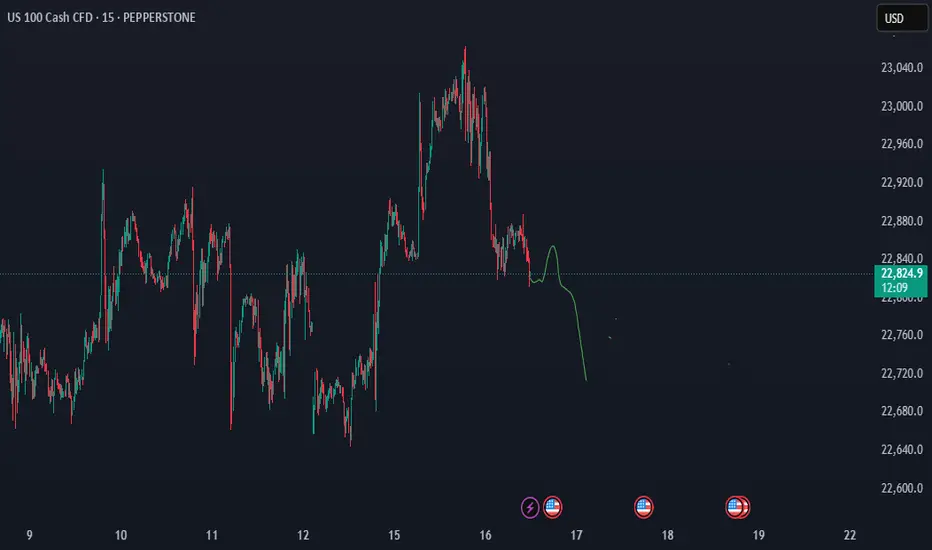
US100: The only risk remains Trump with his tariffs.US100: The only risk remains Trump with his tariffs.
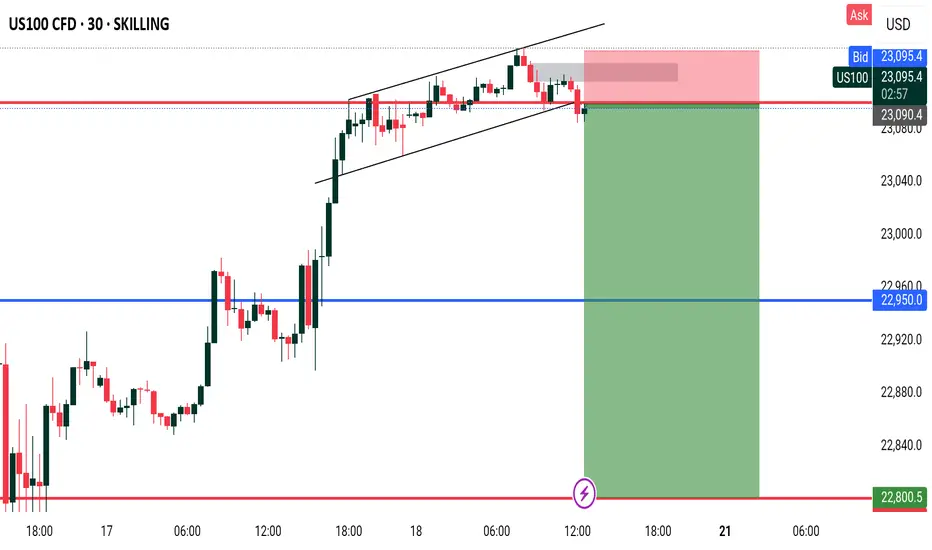
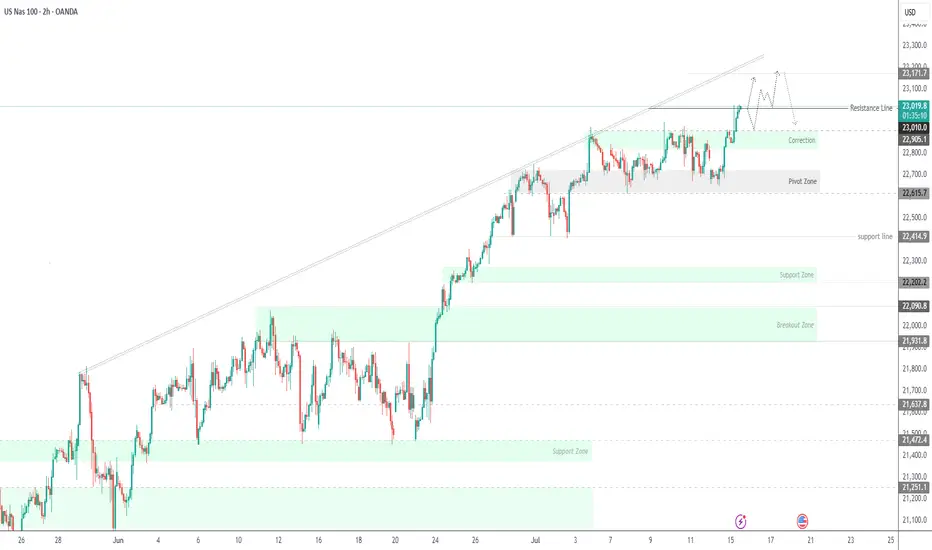
US100 is in a strong uptrend and the chances of it rising are still high.
The price has already found a strong support near 22600 and I think it is preparing to start an uptrend soon.
The only risk for the Indices is related to Trump and his tariffs. This is the only threat I see at the moment.
Key targets: 22875 ; 22997; 23075
You may find more details in the chart!
Thank you and Good Luck!
PS: Please support with a like or comment if you find this analysis useful for your trading day
NAS100 trade ideas

NASDAQ possible Down Reverse Zone For Short Term According to the current market situation, the strength of sellers getting little bit stronger as yesterday news makes USD stronger. Let's see how things going on and waiting for a one up pullback for make day trading sell entry
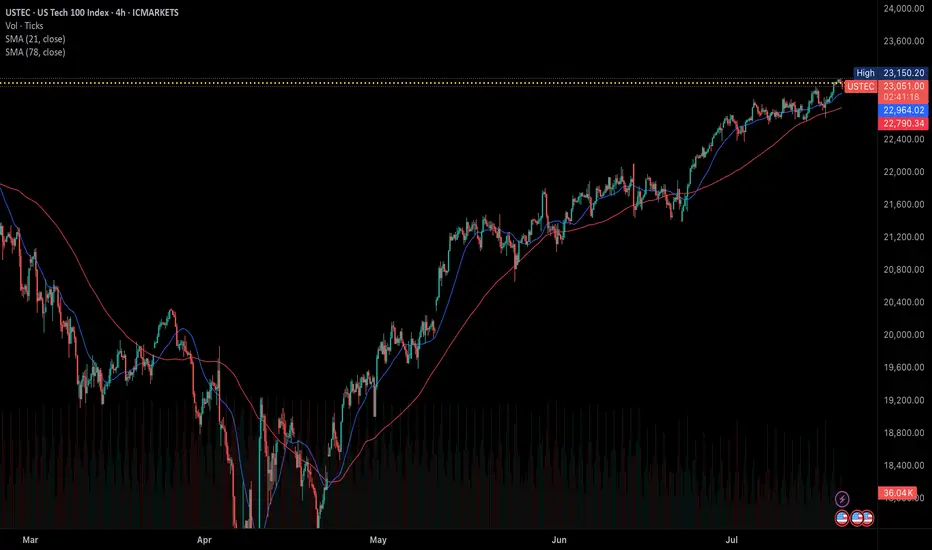
US consumer sentiment improved in Jun could boost US indices The US July Michigan Consumer Sentiment Index increased to 61.8 from 60.7, while the 12-month inflation expectation decreased to 3.6% from 4% in the previous month. This suggests an easing of inflation concerns and improved consumption optimism.
This data, coupled with recent stronger Retail Sales figures, continues to support expectations for robust US economic growth amidst trade tariff uncertainties. Inflation is anticipated to have a limited short-term impact. Concurrently, the approval for AMD and Nvidia (NVDA) to export AI chips to China further bolsters the US tech sector.
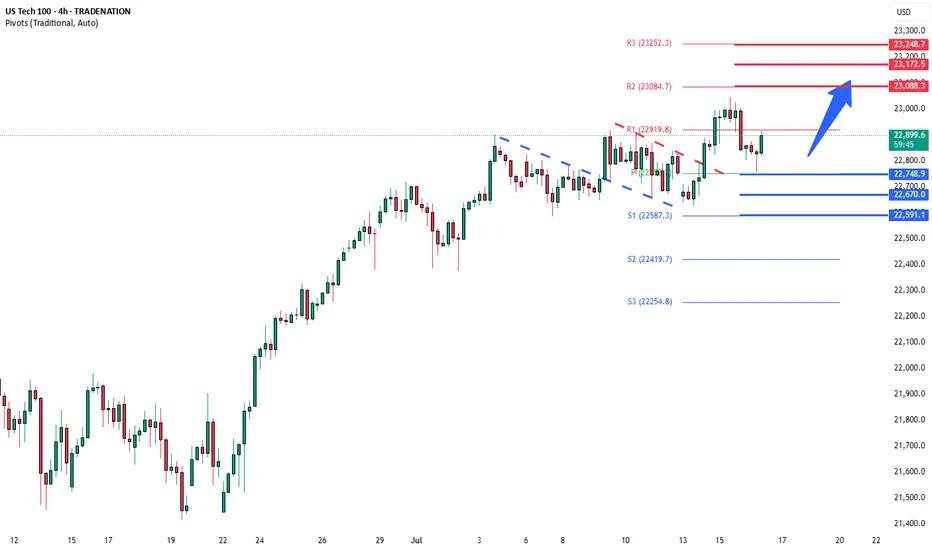
The USTEC is currently in an upward trend, having reached a new high before a slight retreat. It is trading above both the EMA21 and EMA78, indicating higher highs and higher lows, suggesting the rally could persist.
Should the USTEC continue its surge, the index may test the resistance level at 23,200. Conversely, a failure to maintain above the trendline could trigger a decline towards the next support at 22,600.
By Van Ha Trinh - Financial Market Strategist from Exness
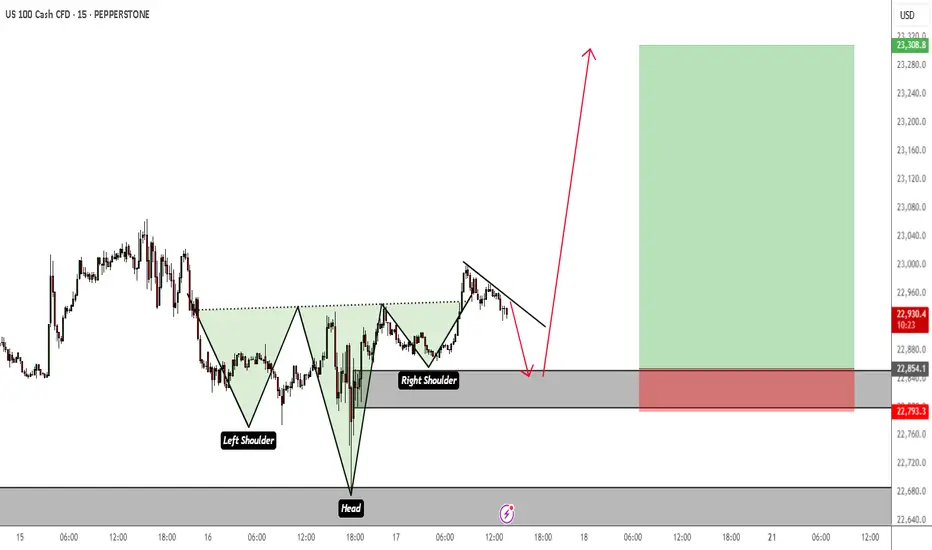
NAS100 (CASH100) SHORT - head and shoulders 30minRisk/reward = 3.9
Entry price = 23 137.9
Stop loss price = 23 153.9
Take profit level 1 (50%) = 23 071
Take profit level 2 (50%) = 23 060
Still need to validate a few variables.
Lets goooooo

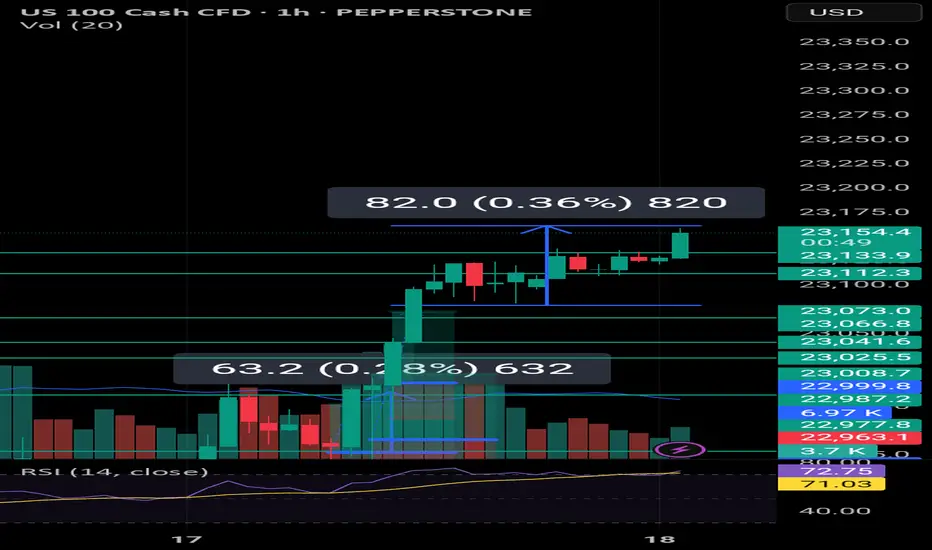
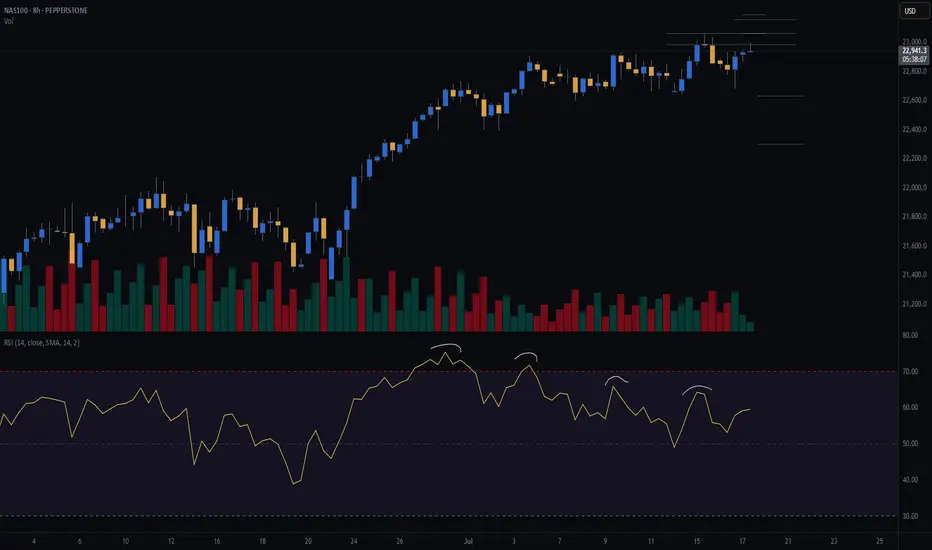
Weekly Close High to HOLD?As expected Nas100 will end in a weekly high after hitting a nice fresh record due to TSMI stock among other things like Trump walking back on firing Jermone Powell.
Technicals tell me that this is extremely overbought and I wonder if this will continue I cannot believe this rally. AS LONG as it holds the 23100 to 23150 range then it could break out again and set another high but I would be cautiously optimistic. Somebody's got to take the profit!
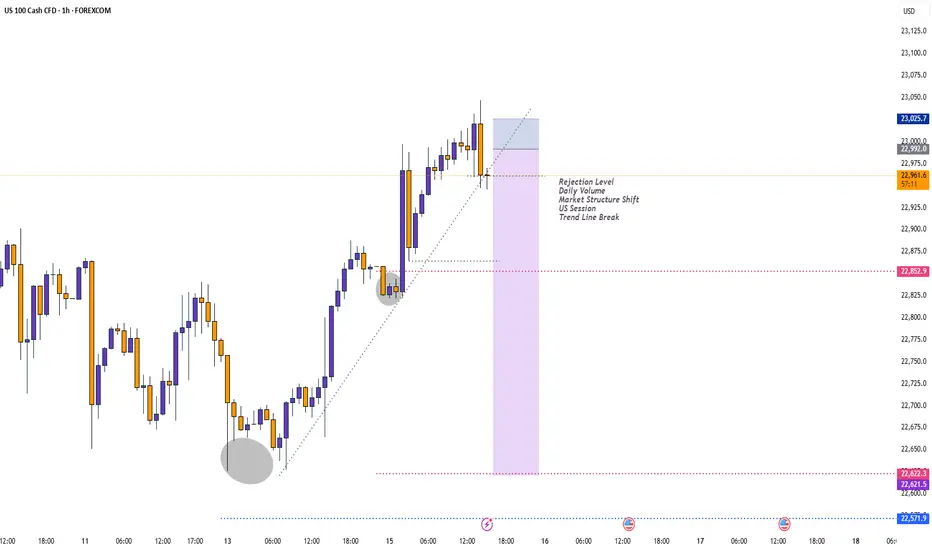
SellRejection Level
Daily Volume
Market Structure Shift
London US Session
Trend Line Break
Untapped Order Point
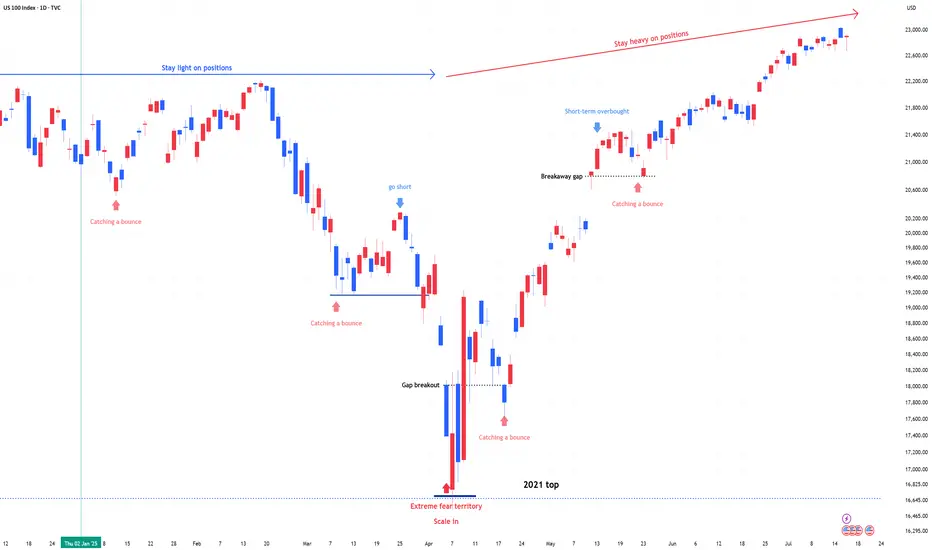
US 100 (NDQ) : Stay Heavy on Positions1) April Fear & Buy Signals
In early April, the Nasdaq 100 experienced a sharp sell-off, triggering extreme fear sentiment across the market.
At that point, scale-in buy signals appeared—classic "buy the fear" conditions.
2) Current Market State: No More Fear, but Watching
Since then, the market has stabilized.
The fear has disappeared, but we are still in a wait-and-see mode as traders assess the next move.
Momentum is holding, but participation remains cautious.
3) Stay Heavy on Positions
Despite short-term uncertainty, I’m maintaining an overweight position on the Nasdaq 100.
As long as we don’t see a major breakdown, the bias remains bullish.
NAS100 (CASH100) SHORT - Double Top H8Risk/reward = 4.6
Entry price = 23 063
Stop loss price = 23 190
Take profit level 1 (50%) = 22 635
Take profit level 2 (50%) = 22 303
Still waiting for confirmation on some variables.
For example, need H8 candle to close in range and volume to validate, amongst other variables.
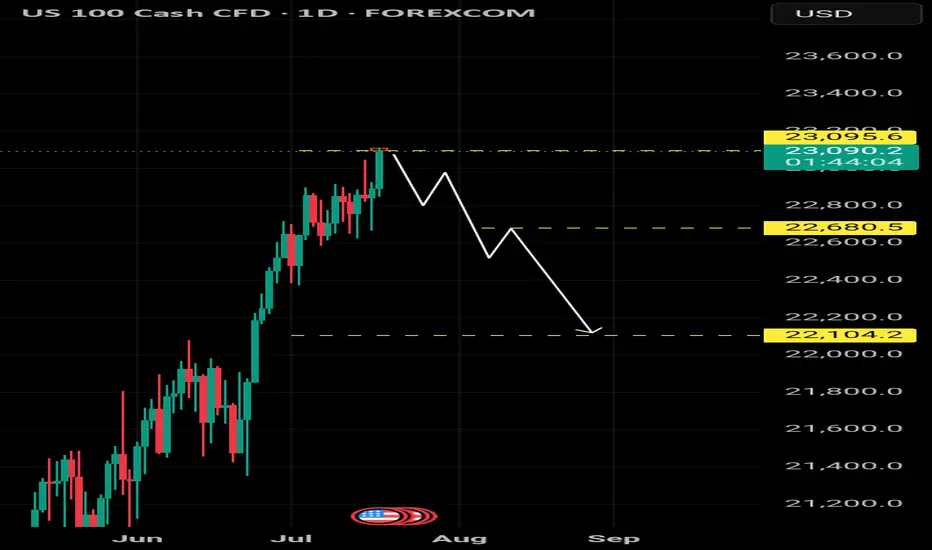
NASDAQ Outlook – Coming WeeksIn the coming weeks, we may see a potential downward move in the NASDAQ, provided that it fails to hold above the current level at 23,100.
If the index remains unstable below this level, a sharp decline toward the 22,800 zone is likely.
USNAS100 Outlook – CPI Data to Confirm Breakout or PullbackUSNAS100 – Bullish Momentum Holds Ahead of CPI
USNAS100 continues to show strong bullish momentum, trading above 22,905 and recently printing a new all-time high (ATH).
As long as price remains above this level, the next upside target is 23,170, followed by 23,300.
Market Focus – CPI Data Today:
• Expected: 2.6%
• Below 2.6% → bullish reaction likely
• Above 2.6% → bearish pressure expected
• Exactly 2.6% → could trigger a short-term bearish pullback
Key Risk Level:
A confirmed break below 22,905 would signal weakness and open the door for a correction toward 22,615.
NASDAQ Inverted Head & Shoulders Retest Before Bullish MomentumI see a possible retest of an Inverted Head and Shoulders on M15 TF before the bullish momentum resumes. The SL and TP are just a rough estimation. Price could dip a bit lower than that.
But my overall bias is bullish.
NASDAQ 100: AI Momentum and Resilient Earnings Drive New HighsThe NASDAQ 100 continues its strong uptrend 📈, recently breaking to new highs after a period of consolidation. The rally is broad-based but remains led by heavyweight tech names and AI-related stocks 🤖.
Key Fundamental Drivers:
AI & Tech Growth 🤖💡: The biggest catalyst is the ongoing boom in artificial intelligence and digital transformation. Companies in the index, especially the “Magnificent Seven” (like NVIDIA, Microsoft, Apple), are seeing robust earnings growth and strong investor demand for AI exposure. Global IT spending is projected to grow by over 9% in 2025, with AI spending up nearly 30% year-on-year.
Earnings Resilience 💪💰: Despite high interest rates and inflation, tech companies have adapted well, maintaining strong margins and growth. The sector is expected to remain a top performer through 2025.
Fed Policy & Rate Expectations 🏦🔮: Markets are increasingly pricing in a pause or even cuts in US interest rates later in 2025, which is bullish for growth stocks and tech-heavy indices like the NASDAQ 100.
Geopolitical & Macro Factors:
Reduced Uncertainty 🌏🕊️: The market has absorbed major geopolitical shocks (such as the Israel-Iran conflict and US-China trade tensions), and the resolution or de-escalation of these risks has reduced uncertainty, supporting risk assets.
US Election & Policy 🇺🇸🗳️: The outcome of the US election and expectations for stable or pro-business policies have also contributed to positive sentiment.
Global Supply Chains & Resilience 🌐🔗: While some risks remain (e.g., cyber threats, regulatory changes, and supply chain disruptions), the tech sector’s global reach and adaptability have helped it weather these challenges.
Why is it rallying now?
AI optimism and strong tech earnings are the main drivers 🤖💹.
Expectations of easier Fed policy and a resilient US economy are fueling risk appetite 🏦📈.
Geopolitical risks have eased or are being priced in, allowing investors to focus on growth 🌍🕊️.
Summary:
The NASDAQ 100’s rally is powered by AI-driven tech growth 🤖, resilient earnings 💪, and easing macro/geopolitical risks 🌏. The index remains a global leader as investors bet on the next wave of technology and digital innovation 🚀.

Trade, Fed, and Policy Developments Impacting NASDAQ 100Tariff Expansion Threat:
Donald Trump signaled upcoming tariffs on pharmaceuticals and semiconductors, two sectors heavily represented in the NASDAQ 100. These measures could:
Raise consumer costs.
Disrupt tech and healthcare supply chains.
Add margin pressure on multinational firms.
Corporate Impact:
Rio Tinto revealed $300M in losses from US aluminum tariffs on Canadian output.
Canada-US trade talks will intensify, but tariffs appear likely to remain, adding to cost overhang for manufacturers and downstream users.
Fed Leadership Uncertainty:
Kevin Hassett is emerging as the frontrunner to replace Fed Chair Jerome Powell in 2026.
Trump is critical of Powell, even citing Fed building renovation costs as a potential fireable offense.
This adds uncertainty to monetary policy continuity, especially as inflation rises and rate path expectations diverge.
401(k) and Private Equity Access:
The administration is finalizing an executive order allowing 401(k) plans to invest in private equity, a move that could:
Increase alternative asset exposure.
Boost private market valuations.
Signal a policy tilt toward financial market liberalization, which may help sustain risk sentiment in the medium term.
Conclusion for NASDAQ 100 (NSDQ100) Trading
The near-term risk for NASDAQ 100 is tilted negative due to the tariff threats on semiconductors and pharma, both major index components.
Fed leadership uncertainty could inject volatility into rate expectations, pressuring tech valuations sensitive to discount rate changes.
However, the longer-term policy shift toward broader 401(k) access to private markets could support overall market sentiment and capital flows.
Bias: Cautiously Bearish in the short term due to trade and Fed risks; neutral to slightly bullish medium term if private capital access reforms proceed and trade escalation is contained.
Key Support and Resistance Levels
Resistance Level 1: 23080
Resistance Level 2: 23170
Resistance Level 3: 23250
Support Level 1: 22750
Support Level 2: 22670
Support Level 3: 22590
This communication is for informational purposes only and should not be viewed as any form of recommendation as to a particular course of action or as investment advice. It is not intended as an offer or solicitation for the purchase or sale of any financial instrument or as an official confirmation of any transaction. Opinions, estimates and assumptions expressed herein are made as of the date of this communication and are subject to change without notice. This communication has been prepared based upon information, including market prices, data and other information, believed to be reliable; however, Trade Nation does not warrant its completeness or accuracy. All market prices and market data contained in or attached to this communication are indicative and subject to change without notice.
USNAS100 – Bearish Below 22900 as Earnings & Tariffs Hit MarketUSNAS100 – Bearish Bias Ahead of Earnings, PPI & Tariff Tensions
S&P 500 and Nasdaq futures are slightly lower as traders weigh rate outlook, tariff developments, and major earnings reports.
📊 Earnings in Focus:
Goldman Sachs NYSE:GS , Morgan Stanley NYSE:MS , and Bank of America NYSE:BAC are set to report today.
JPMorgan Chase NYSE:JPM and Citigroup NYSE:C posted strong results yesterday, but expressed caution over U.S. tariff policies.
🌍 Tariff Watch:
Trump announced a 19% tariff on Indonesian goods, with more deals anticipated ahead of the August 1 tariff deadline. The EU is reportedly preparing retaliatory measures if negotiations stall.
🔧 Technical Outlook:
The Nasdaq100 shows bearish momentum as long as it trades below 22900 and 23010, with potential downside targets:
Support: 22720 → 22615 → 22420
Resistance: 23010 → 23170
To shift back to a bullish trend, price must stabilize above 22900 and break 23010.
Key Events Today:
• Corporate Earnings
• Tariff Developments
• U.S. PPI Report

Nas100USD (LONG)
Price had been respecting the resistance trendline for months/years.
USD is at it support level which means indicies will go short
Perfect correlation.

NQ Buy within range The overall trend is ranging, but the price recently created a new ATH and now it seem to be grabbing liquidity. With that, we can expect the price to continue pushing up to at least grab the liquidity above 23029.47.
NAS100 formed a bullish Flag Wait for Breakout NAS100 has recently formed a Flag pattern and price is currently consolidating in the flag channel(box) pattern and wait for the breakout can easily take the price to 23500-23600.

[BUY] Bullish ORDERBLOCK Demand ZoneBreak of structure at the daily creating a higher high
Entered longs at the demandzone/orderblock as highlighted.
SL at daily support (higher low)
Target recent highs at 22,920
COT data indicates that last week, institutions continued to buy NASDAQ heavily.

NAS100 Is Very Bullish! Long!
Take a look at our analysis for NAS100.
Time Frame: 12h
Current Trend: Bullish
Sentiment: Oversold (based on 7-period RSI)
Forecast: Bullish
The market is on a crucial zone of demand 23,006.9.
The oversold market condition in a combination with key structure gives us a relatively strong bullish signal with goal 23,667.5 level.
P.S
Overbought describes a period of time where there has been a significant and consistent upward move in price over a period of time without much pullback.
Disclosure: I am part of Trade Nation's Influencer program and receive a monthly fee for using their TradingView charts in my analysis.
Like and subscribe and comment my ideas if you enjoy them!

NASDAQ Is looking for a massive break-out to 24000!Nasdaq (NDX) is most likely taking advantage of the 4H MA50 (blue trend-line) as a Support and after hitting it, it appears that the price will look for a way above the Parabola.
This might be similar to what took place after the May 07 test of the 4H MA50. The price broke above that parabolic pattern and peaked on the 2.0 Fibonacci extension. As a result, we are looking for 24000 as a potential Target in the next 2 weeks.
-------------------------------------------------------------------------------
** Please LIKE 👍, FOLLOW ✅, SHARE 🙌 and COMMENT ✍ if you enjoy this idea! Also share your ideas and charts in the comments section below! This is best way to keep it relevant, support us, keep the content here free and allow the idea to reach as many people as possible. **
-------------------------------------------------------------------------------
Disclosure: I am part of Trade Nation's Influencer program and receive a monthly fee for using their TradingView charts in my analysis.
💸💸💸💸💸💸
👇 👇 👇 👇 👇 👇

NAS100/US100 Short Swing Trade for week Risking 1% to make 2%PEPPERSTONE:NAS100 / CAPITALCOM:US100 Short trade for week - its swing trade, with my back testing of this strategy, it hits multiple possible take profits, manage your position accordingly.
This is good trade, don't overload your risk like greedy, be disciplined trader, this is good trade.
Use proper risk management
Looks like good trade.
Lets monitor.
Use proper risk management.
Disclaimer: only idea, not advice
