UK100 Buy ZoneSee how price reacts in this zones, I'm looking for entries like those marked on the chart.
UK100 trade ideas

UK100 - Trade IdeaHi all,
Here we have a strong Counter Trend setup, in my own opinion it looks to be very strong with no resting Liquidity sitting higher telling me price will want to chase for that sell side Imbalance.
It is a counter trend setup so its a high risk to high reward but could be worth the trade.
Ill be keeping my eyes on this for the close future to see how Price Action develops.
Good luck if you decide to follow this trade idea
Cheers

FTSE 100 Wave Analysis – 17 March 2025
- FTSE 100 reversed from key support level 8425.00
- Likely to rise to resistance level 8832.00
FTSE 100 index recently reversed up from the key support level 8425.00, a former strong resistance from last year, which has stopped multiple upward impulses from May to December as can be seen from the daily FTSE 100 chart below.
The support level 8425.00 was strengthened by the lower daily Bollinger Band and by the 50% Fibonacci correction of the sharp upward impulse from December.
Given the clear daily uptrend, FTSE 100 index can be expected to rise to the next resistance level 8832.00 (which reversed the previous waves 3 and b).

FTSE INTRADAY Bullish breakoutThe FTSE 100 index is currently exhibiting a neutral sentiment, as evidenced by the prevailing sideways consolidation. The primary focus remains on the key resistance level at 8700, which corresponds to the current intraday swing high. This level is critical as it determines the next directional move of the index.
From the current levels, an oversold rally could potentially emerge, leading to a retest of the 8700 resistance. A bearish rejection from this level would reinforce the downtrend, paving the way for a move towards the 8500 support. Further downside momentum could extend losses to the next support levels at 8440 and 8352 over a longer timeframe.
On the other hand, a confirmed breakout above 8700 on a daily closing basis would invalidate the bearish outlook. In such a scenario, the index is likely to experience renewed buying interest, targeting the next resistance at 8770, followed by a potential rally towards the 8834 level.
Conclusion:
The overall sentiment for the FTSE 100 remains bearish unless a decisive breakout above the 8700 resistance occurs. Traders should monitor price action around this critical level for confirmation of either a continuation of the downtrend or a potential bullish reversal.
This communication is for informational purposes only and should not be viewed as any form of recommendation as to a particular course of action or as investment advice. It is not intended as an offer or solicitation for the purchase or sale of any financial instrument or as an official confirmation of any transaction. Opinions, estimates and assumptions expressed herein are made as of the date of this communication and are subject to change without notice. This communication has been prepared based upon information, including market prices, data and other information, believed to be reliable; however, Trade Nation does not warrant its completeness or accuracy. All market prices and market data contained in or attached to this communication are indicative and subject to change without notice.

Bullish bounce?UK100 has bounced off the pivot and could rise to the 1st resistance.
Pivot; 8,460.55
1st Support: 8,314.59
1st Resistance; 8,913.87
Risk Warning:
Trading Forex and CFDs carries a high level of risk to your capital and you should only trade with money you can afford to lose. Trading Forex and CFDs may not be suitable for all investors, so please ensure that you fully understand the risks involved and seek independent advice if necessary.
Disclaimer:
The above opinions given constitute general market commentary, and do not constitute the opinion or advice of IC Markets or any form of personal or investment advice.
Any opinions, news, research, analyses, prices, other information, or links to third-party sites contained on this website are provided on an "as-is" basis, are intended only to be informative, is not an advice nor a recommendation, nor research, or a record of our trading prices, or an offer of, or solicitation for a transaction in any financial instrument and thus should not be treated as such. The information provided does not involve any specific investment objectives, financial situation and needs of any specific person who may receive it. Please be aware, that past performance is not a reliable indicator of future performance and/or results. Past Performance or Forward-looking scenarios based upon the reasonable beliefs of the third-party provider are not a guarantee of future performance. Actual results may differ materially from those anticipated in forward-looking or past performance statements. IC Markets makes no representation or warranty and assumes no liability as to the accuracy or completeness of the information provided, nor any loss arising from any investment based on a recommendation, forecast or any information supplied by any third-party.

FTSE100 The Week Ahead 17th March '25FTSE100 INTRADAY bullish & oversold, the key trading level is at 8520
This communication is for informational purposes only and should not be viewed as any form of recommendation as to a particular course of action or as investment advice. It is not intended as an offer or solicitation for the purchase or sale of any financial instrument or as an official confirmation of any transaction. Opinions, estimates and assumptions expressed herein are made as of the date of this communication and are subject to change without notice. This communication has been prepared based upon information, including market prices, data and other information, believed to be reliable; however, Trade Nation does not warrant its completeness or accuracy. All market prices and market data contained in or attached to this communication are indicative and subject to change without notice.

"UK100 / FTSE100" Indices Market Bullish Heist Plan🌟Hi! Hola! Ola! Bonjour! Hallo!🌟
Dear Money Makers & Thieves, 🤑 💰🐱👤🐱🏍
Based on 🔥Thief Trading style technical and fundamental analysis🔥, here is our master plan to heist the "UK100 / FTSE100" Indices Market. Please adhere to the strategy I've outlined in the chart, which emphasizes long entry. Our aim is the high-risk Red Zone. Risky level, overbought market, consolidation, trend reversal, trap at the level where traders and bearish robbers are stronger. 🏆💸Book Profits, Be wealthy and safe trade.💪🏆🎉
Entry 📈 : "The heist is on! Wait for the MA breakout (8850.00) then make your move - Bullish profits await!"
however I advise to placing the Buy Stop Orders above the breakout MA or placing the Buy limit orders within a 15 or 30 minute timeframe. Entry from the most recent or closest low or high level should be in retest.
Stop Loss 🛑: Thief SL placed at 8720.00 (swing Trade Basis) Using the 4H period, the recent / Swing Low or High level.
SL is based on your risk of the trade, lot size and how many multiple orders you have to take.
Target 🎯: 9150.00 (or) Escape Before the Target
🧲Scalpers, take note 👀 : only scalp on the Long side. If you have a lot of money, you can go straight away; if not, you can join swing traders and carry out the robbery plan. Use trailing SL to safeguard your money 💰.
📰🗞️Fundamental, Macro, COT, Sentimental Outlook:
"UK100 / FTSE100" Indices Market is currently experiencing a bullish trend,., driven by several key factors.
🟤Market Overview
Current Price: 8740.00
30-Day High: 8920.00
30-Day Low: 8450.00
30-Day Average: 8630.00
🔵Fundamental Analysis
Economic Trends: The UK economy is expected to grow, driven by a rebound in consumer spending and investment
Interest Rates: The Bank of England is expected to maintain low interest rates, supporting the UK stock market
🟢Macro Economics
Global Economic Trends: The ongoing global economic recovery is expected to drive up demand for UK exports
Inflation Rate: Global inflation is expected to rise to 3.8% in 2025, potentially increasing demand for UK goods and services
Interest Rates: Central banks are expected to maintain low interest rates in 2025, supporting stock markets
🟡COT Data
Non-Commercial Traders (Institutional):
Net Long Positions: 52%
Open Interest: 120,000 contracts
Commercial Traders (Companies):
Net Short Positions: 28%
Open Interest: 80,000 contracts
Non-Reportable Traders (Small Traders):
Net Long Positions: 20%
Open Interest: 40,000 contracts
COT Ratio: 1.9 (indicating a bullish trend)
🟠Sentimental Analysis
Institutional Sentiment: 58% bullish, 42% bearish
Retail Sentiment: 55% bullish, 45% bearish
Market Mood: The overall market mood is bullish, with a sentiment score of +25
🔴Positioning Analysis
Institutional Traders: Net long positions increased by 8% over the past week, indicating growing bullish sentiment
Retail Traders: Net long positions decreased by 3% over the past week, indicating decreasing bullish sentiment
Leverage: The average leverage used by traders has increased to 2.8, indicating growing confidence in the market
⚫Overall Outlook
The overall outlook for UK100 is bullish, driven by a combination of fundamental, technical, and sentimental factors. The expected growth in the UK economy, low interest rates, and bullish market sentiment are all supporting the bullish trend. However, investors should remain cautious of potential downside risks, including changes in global economic trends and unexpected regulatory developments.
⚠️Trading Alert : News Releases and Position Management 📰 🗞️ 🚫🚏
As a reminder, news releases can have a significant impact on market prices and volatility. To minimize potential losses and protect your running positions,
we recommend the following:
Avoid taking new trades during news releases
Use trailing stop-loss orders to protect your running positions and lock in profits
📌Please note that this is a general analysis and not personalized investment advice. It's essential to consider your own risk tolerance and market analysis before making any investment decisions.
📌Keep in mind that these factors can change rapidly, and it's essential to stay up-to-date with market developments and adjust your analysis accordingly.
💖Supporting our robbery plan will enable us to effortlessly make and steal money 💰💵 Tell your friends, Colleagues and family to follow, like, and share. Boost the strength of our robbery team. Every day in this market make money with ease by using the Thief Trading Style.🏆💪🤝❤️🎉🚀
I'll see you soon with another heist plan, so stay tuned 🤑🐱👤🤗🤩

T/R zonesThis idea is based on transient/recurrent zones
Very high probability (90%+) for the price to hit TP.
Probability was calculated on TF 15min.

FTSE INTRADAY bearish oversold bounce backThe FTSE 100 index is currently exhibiting a bearish sentiment, as evidenced by the prevailing downtrend. The primary focus remains on the key resistance level at 8638, which corresponds to the current intraday swing high and the falling resistance trendline. This level is critical as it determines the next directional move of the index.
From the current levels, an oversold rally could potentially emerge, leading to a retest of the 8638 resistance. A bearish rejection from this level would reinforce the downtrend, paving the way for a move towards the 8520 support. Further downside momentum could extend losses to the next support levels at 8476 and 8327 over a longer timeframe.
On the other hand, a confirmed breakout above 8638 on a daily closing basis would invalidate the bearish outlook. In such a scenario, the index is likely to experience renewed buying interest, targeting the next resistance at 8693, followed by a potential rally towards the 8760 level.
Conclusion:
The overall sentiment for the FTSE 100 remains bearish unless a decisive breakout above the 8638 resistance occurs. Traders should monitor price action around this critical level for confirmation of either a continuation of the downtrend or a potential bullish reversal.
This communication is for informational purposes only and should not be viewed as any form of recommendation as to a particular course of action or as investment advice. It is not intended as an offer or solicitation for the purchase or sale of any financial instrument or as an official confirmation of any transaction. Opinions, estimates and assumptions expressed herein are made as of the date of this communication and are subject to change without notice. This communication has been prepared based upon information, including market prices, data and other information, believed to be reliable; however, Trade Nation does not warrant its completeness or accuracy. All market prices and market data contained in or attached to this communication are indicative and subject to change without notice.

Overlap resistance ahead?UK100 is rising towards the pivot which has been identified as an overlap resistance and could drop to the pullback support.
Pivot: 8,628.83
1st Support: 8,461.16
1st Resistance: 8,745.12
Risk Warning:
Trading Forex and CFDs carries a high level of risk to your capital and you should only trade with money you can afford to lose. Trading Forex and CFDs may not be suitable for all investors, so please ensure that you fully understand the risks involved and seek independent advice if necessary.
Disclaimer:
The above opinions given constitute general market commentary, and do not constitute the opinion or advice of IC Markets or any form of personal or investment advice.
Any opinions, news, research, analyses, prices, other information, or links to third-party sites contained on this website are provided on an "as-is" basis, are intended only to be informative, is not an advice nor a recommendation, nor research, or a record of our trading prices, or an offer of, or solicitation for a transaction in any financial instrument and thus should not be treated as such. The information provided does not involve any specific investment objectives, financial situation and needs of any specific person who may receive it. Please be aware, that past performance is not a reliable indicator of future performance and/or results. Past Performance or Forward-looking scenarios based upon the reasonable beliefs of the third-party provider are not a guarantee of future performance. Actual results may differ materially from those anticipated in forward-looking or past performance statements. IC Markets makes no representation or warranty and assumes no liability as to the accuracy or completeness of the information provided, nor any loss arising from any investment based on a recommendation, forecast or any information supplied by any third-party.

THE IMPORTANCE OF TREND FOLLOWINGMost people tend to not check the overall trend not knowing that could potential be a danger to their trades and account
If the overall trend is a downtrend(making lower lows and lower high)- you should look only for selling entries especially if you trade bigger time frames(M15 to upwards). However it's not that simple or everyone would be making millions of dollars lol.
when you check the overall trend you should make sure the swing lows and high are clear, strong and the bearish/bullish pressure(volatility) should also be strong and clear if one of these is missing
then it's best to stay away from the market or you'll become liquidity for other trades😂
so all in all, combine your Trend following with liquidity and market volatility.

UK100 about to drop again?good day traders, our past trades were a success and as you can see UK100 is repeating the same pattern again, meaning we are anticipating another drop, I won't explain much because it's simple and clear analysis that is self-explanatory. all I can say is wait for a candle rejection and enter

UK100 - Looking To Sell Pullbacks In The Short TermH1 - Bearish trend pattern
Currently it looks like a pullback is happening
Until the strong resistance zone holds I expect the price to move lower further after pullbacks.

Bullish bounce off pullback support?UK100 has bounced off the pivot which is a pullback support and could rise to the 1st resistance which is also a pullback resistance.
Pivot: 8,538.25
1st Support: 8,442.68
1st Resistance: 8,743.14
Risk Warning:
Trading Forex and CFDs carries a high level of risk to your capital and you should only trade with money you can afford to lose. Trading Forex and CFDs may not be suitable for all investors, so please ensure that you fully understand the risks involved and seek independent advice if necessary.
Disclaimer:
The above opinions given constitute general market commentary, and do not constitute the opinion or advice of IC Markets or any form of personal or investment advice.
Any opinions, news, research, analyses, prices, other information, or links to third-party sites contained on this website are provided on an "as-is" basis, are intended only to be informative, is not an advice nor a recommendation, nor research, or a record of our trading prices, or an offer of, or solicitation for a transaction in any financial instrument and thus should not be treated as such. The information provided does not involve any specific investment objectives, financial situation and needs of any specific person who may receive it. Please be aware, that past performance is not a reliable indicator of future performance and/or results. Past Performance or Forward-looking scenarios based upon the reasonable beliefs of the third-party provider are not a guarantee of future performance. Actual results may differ materially from those anticipated in forward-looking or past performance statements. IC Markets makes no representation or warranty and assumes no liability as to the accuracy or completeness of the information provided, nor any loss arising from any investment based on a recommendation, forecast or any information supplied by any third-party.

UK100 ShortUK100 short on the regression break.
Global markets are under pressure.
I am considering this trade and the EA to use.

FTSE100 INTRADAY , previous support - new resistance at 8760The FTSE equity index currently shows a bearish sentiment, driven by the breakdown of the long-term prevailing uptrend. The recent oversold bounceback is attempting to retest major resistance at 8760, which marks the intraday swing high and aligns with the falling resistance trendline.
Key Support and Resistance Levels
Resistance Level 1: 8760 (intraday swing high and falling trendline resistance)
Resistance Level 2: 8837
Resistance Level 3: 8900
Support Level 1: 8565
Support Level 2: 8476
Support Level 3: 8327
Bearish Scenario
If the oversold rally is met with a bearish rejection at the 8760 resistance level, it would reaffirm the bearish outlook. This could trigger a decline targeting the 8565 support level, followed by further downside movement toward 8476 and 8327 over the longer timeframe.
Bullish Scenario
Alternatively, a confirmed breakout above 8760 resistance and a daily close above this level would invalidate the bearish bias. This scenario could set the stage for further rallies, with potential upside targets at 8837 and ultimately 8900.
Conclusion
The FTSE index exhibits a bearish continuation setup, with the 8760 resistance level being crucial. A rejection at this level could prompt a renewed move lower, while a breakout would signal bullish momentum and open the way for further gains. Traders should watch for decisive price action around 8760 to determine the next directional bias.
This communication is for informational purposes only and should not be viewed as any form of recommendation as to a particular course of action or as investment advice. It is not intended as an offer or solicitation for the purchase or sale of any financial instrument or as an official confirmation of any transaction. Opinions, estimates and assumptions expressed herein are made as of the date of this communication and are subject to change without notice. This communication has been prepared based upon information, including market prices, data and other information, believed to be reliable; however, Trade Nation does not warrant its completeness or accuracy. All market prices and market data contained in or attached to this communication are indicative and subject to change without notice.

UK100 NextUK100 next buying for long area, BOS in Daily time frame & confirmation in other time frame

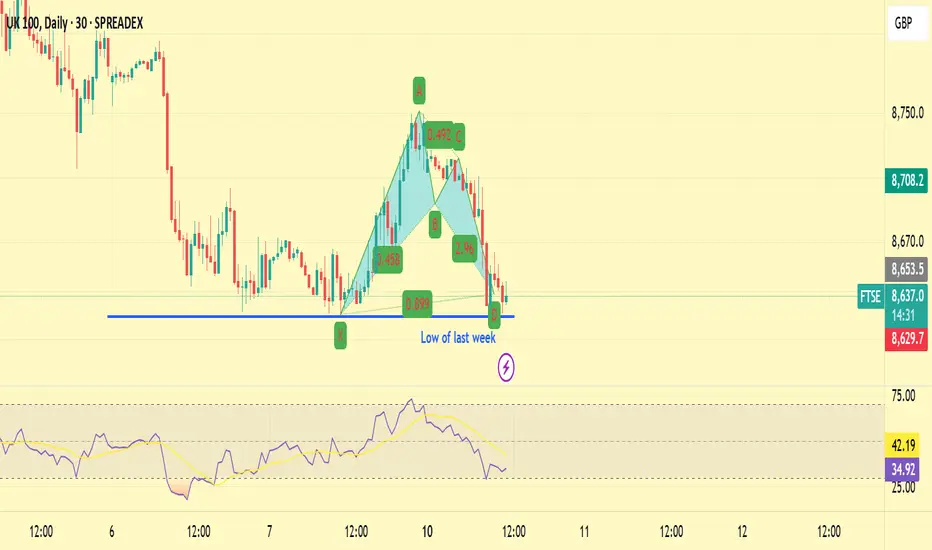
A BUY of FTSE at last week's lowHere is why we are buying this pair at 8635.
1) It is well supported by last week's low
2) There was a big pattern last week to buy at the same area. This level is being retested.
3) There is a small pattern to buy right now (Although not clear on this platform)
4) M15 divergence in place.
Stops is about 40 pips.
FTSE 100 OutlookCurrently, I see the FTSE 100 in a short-term bearish phase, having broken the last key demand zone that supported the BOS (Break of Structure) to all-time highs (ATH). This signals that bearish momentum could continue, with price potentially seeking lower liquidity before finding support. However, my long-term outlook remains bullish, with the earliest signs of a potential resumption likely appearing around the green demand zones at the bottom of my chart.
From a macro perspective, slowing/stalling UK economic growth (with a projected GDP m/m from 0.4% to 0.1% 14/03/25 ) could put downward pressure on the index and provide a more clearer outlook for the month

FTSE100 (UK100) The Week Ahead 10th March '25Sentiment: Neutral, Price action is consolidating in a tight trading range.
Resistance: Key Resistance is at 8760, followed by 8910 and 9000.
Support: Key support is at 8620 followed by 8536 and 9000.
This communication is for informational purposes only and should not be viewed as any form of recommendation as to a particular course of action or as investment advice. It is not intended as an offer or solicitation for the purchase or sale of any financial instrument or as an official confirmation of any transaction. Opinions, estimates and assumptions expressed herein are made as of the date of this communication and are subject to change without notice. This communication has been prepared based upon information, including market prices, data and other information, believed to be reliable; however, Trade Nation does not warrant its completeness or accuracy. All market prices and market data contained in or attached to this communication are indicative and subject to change without notice.

Bearish drop?UK100 has reacted off the pivot which acts as an overlap resistance and could drop to the 1st support level which is a pullback support.
Pivot: 8,701.78
1st Support: 8,536.52
1st Resistance: 8,783.04
Risk Warning:
Trading Forex and CFDs carries a high level of risk to your capital and you should only trade with money you can afford to lose. Trading Forex and CFDs may not be suitable for all investors, so please ensure that you fully understand the risks involved and seek independent advice if necessary.
Disclaimer:
The above opinions given constitute general market commentary, and do not constitute the opinion or advice of IC Markets or any form of personal or investment advice.
Any opinions, news, research, analyses, prices, other information, or links to third-party sites contained on this website are provided on an "as-is" basis, are intended only to be informative, is not an advice nor a recommendation, nor research, or a record of our trading prices, or an offer of, or solicitation for a transaction in any financial instrument and thus should not be treated as such. The information provided does not involve any specific investment objectives, financial situation and needs of any specific person who may receive it. Please be aware, that past performance is not a reliable indicator of future performance and/or results. Past Performance or Forward-looking scenarios based upon the reasonable beliefs of the third-party provider are not a guarantee of future performance. Actual results may differ materially from those anticipated in forward-looking or past performance statements. IC Markets makes no representation or warranty and assumes no liability as to the accuracy or completeness of the information provided, nor any loss arising from any investment based on a recommendation, forecast or any information supplied by any third-party.

FTSE 100 setting itself for a 600 point Crash?As I did an analysis on downside to potentially come for the S&P500 yesterday, looks like the FTSE is following suit.
If they don't sort out these issues, we could see a 600 points crash for the FTSE...
Here are some reasons...
New U.S. Tariffs:
President Trump imposed a 25% tariff on imports from Mexico and Canada, and increased tariffs on Chinese goods to 20%, sparking fears of a global trade war.
Oil Price Drop:
OPEC+ announced plans to boost oil output in April, leading to a 3% decline in the oil and gas sector.
Weak UK Construction Data:
The UK construction sector faced its most significant downturn since 2020, with the PMI dropping to 44.6 in February, indicating contraction.
Corporate Disappointments: Companies are reporting worse than expected results which is resulting in a lack of confidence in investors.
Melrose – Weak revenue forecast
WPP – Revenue decline, flat 2025 outlook
Quilter – £76m compensation hit, loss reported
Glencore – Lowest profits in 4 years
Shell – Weaker-than-expected annual profits
JD Sports – Multiple profit warnings, stock drop
And the technicals speak for themselves.
We see an M Formation, with the price reaching the neckline. If it breaks below, we could first see the price head to 200MA along with a further crash to 7,992.
We are seeing a pattern with these indices and either this will play out or something drastic will shock the world and will go back to all time highs.
Right now, it's not looking good.
