USDOLLAR Pullback At Key Fib Levels on HourlyThe chart on the left shows FXCM’s USDOLLAR basket on a daily timeframe. It is in the bullish area between the upper red and upper blue bands. The chart on the right shows its hourly time frame. The greenback has pulled back to the 50%/61.8% Fib levels. If these levels hold as support and if the EMAs and the stochastic cross bullishly, the short-term participants may be be syncing up with the long-term chart. If this happens, a movement by the stochastic to the 80 level and the maintenance thereof may be suggestive of an underlying momentum push.
USDOLLAR trade ideas

DOLLAR REVERSAL COMING!!We are ending the quarter with a strong dollar flush to the upside - with price spiking on no volume signaling liquidation of dollar shorts - On the higher TF price is testing major selling zone & resistance & moves like these can witness strong one way reversals if not backed by higher TF conviction - Therefore watch for reversals on specific dollar pairs at the October open, while using this months range as a bias to confirm a reversal (dont short dollar if it breaks above this current Sep range). Technically a reversal at these levels would b significant and can send prices all the way down to the yearly lows!
Watch & see how it plays out!

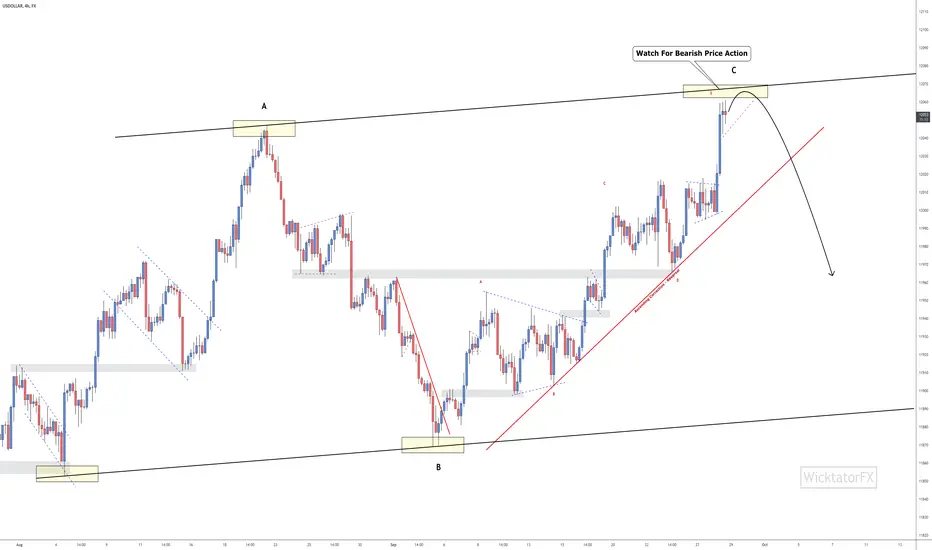
USDOLLAR - Bearish Reversal...?USDollar is at a pivotal point now where it could either shoot up or reverse down from here, the latter validating the ABC parallel correction.
Price appears to be showing rejection but time will tell whether its actually a rejection or just a correction for another move up.
Using this chart to correlate with other USD pairs to find entries.
Goodluck and trade safe!
US DOLLARThe US DOLLAR has been bullish, and it could continue. But, we are hitting some noteworthy Resistance Levels, I always like to find trades that compliment each other... If gold is to turn bullish, that would mean the US DOLLAR would be turning bearish.

DXY SHORTDxy is bearish for the week, price is approaching a good supply zone, which most likely going to push dxy down.

US Dollar Index - Bearish ??US Dollar Index –
After a lot of high impacting news for the dollar this week it is crucial that we determine the direction of the dollar heading into a new week.
News Summary –
There was one question every investor was eager to gain insight on and that was whether we would be given a clear path and date for when the US will begin to start tapering bond purchases.
Powell’s speech certainly gave a hawkish tone however as we were not given a clearer timeline on the above this held the dollar back and is the reason, we didn’t see an impulsive move that matched the hawkish tone we seen. We should continue to monitor closely the numbers coming out of the US over the next few months to give hints as to when the Fed will be pressured into putting the ball into motion so to speak.
Analysis –
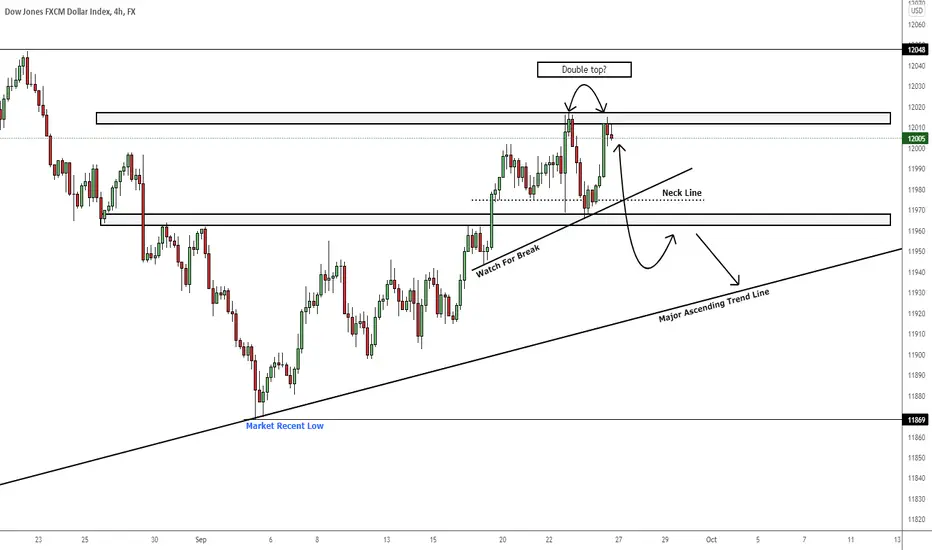
Moving into next week we are looking for a bearish impulsive move from the US Dollar. Moving on to the 4hr chart we can see we have just posted a double top and initially bounced. We anticipate a move down towards the neckline with full confirmation of further bearish pressure on the horizon after a break and retest of the neckline and the minor ascending “watch for break” trend.
We will be monitoring USD pairs for shorting opportunities.
As always, I’d love to hear your thoughts on the US Dollar Index and what your outlook is. Let me know in the comments below.
Hope you have had a profitable week in the markets, and it continues through into next week.
The Fx Chartist
DXY (DOLLAR INDEX)On overall, I have a bullish momentum for the Dollar index but we can see the formation of a head and shoulders which could mean that we are likely to see a bit of USD weakness temporarily.
If we don't see a break above the current support, then we are going to see USD weakness. Only after we see a break of the next suport level at 12046, should we see DXY continuation a bullish move to 12133.
Watch out for the news releases this week that could affect the USD, and as always, trade safe. Like and comment your thoughts.
check linktree in Bio for chart analysis.

USDOLLAR - Right Shoulder Completion ⚠️For more analysis like these, be sure to give it a thumbs up!
Last week we were waiting for the right shoulder to be completed. We moved up nicely to the right shoulder and we capitalised on the XXXUSD shorts, particularly the EURUSD short (see linked chart for EURUSD analysis).
We are now waiting for bearish price action to confirm USD weakness. If we do not get the bearish price action from the right shoulder, the next area we are looking at is the recent highs of 12040 for rejection.
We will be correlating this chart with the XXXUSD charts.
Goodluck and as always, trade safe!

USDOLLARhere is another Nice setup looks cool and ready for trade i am opening position on USDOLLAR trend is still valid ..

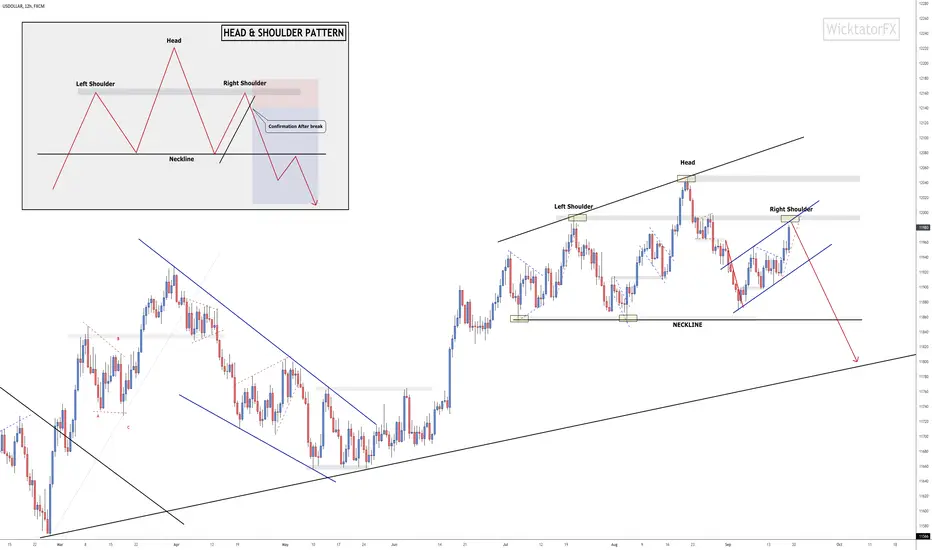
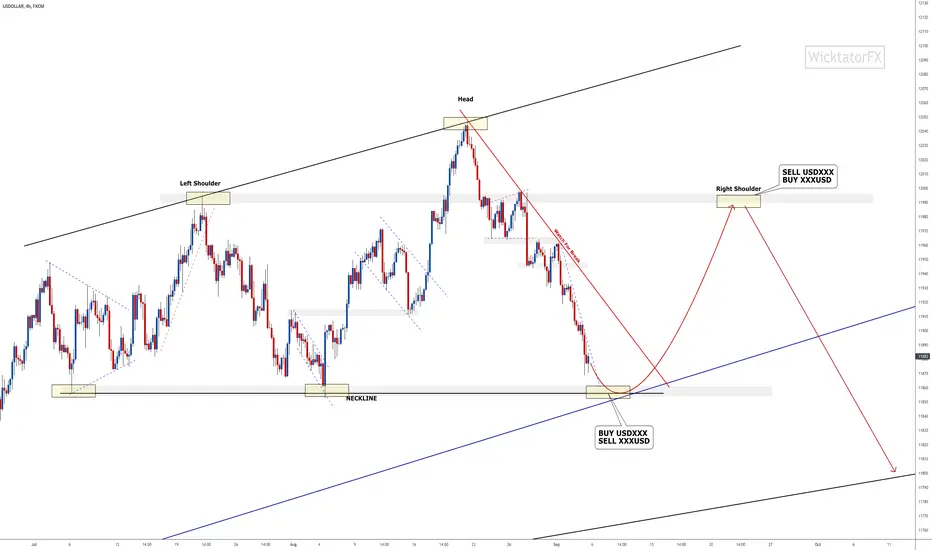
USDOLLAR - Head & Shoulder Completion This Week?Last week we identified the head and shoulder pattern and we were anticipating XXXUSD shorts which played out well. We are still looking for further strength from USD. Looking for the completion of the right shoulder this week. Correlate this chart with the USD pairs and try and get and entry for the XXXUSD shorts.
Goodluck and trade safe!
USD Dollar predictionUS Dollar is showing strength at the moment. Now hitting resistance area, in a downtrend.
We await a break of the short term uptrend, should start to head for S1 (1870) within 4 days and 8 hours.
WWW.THETRADINGMENTORS.COM

down Trend can be Occurichimoku in 2 last days made Downtrend Cross , So US index if can Break Support , we observe Decrease $ index.

USDOLLAR:NEW BULLISH IMPUSE COMING ? LONG VIEW + TARGETS 🔔The Dollar, finally after the release of the NPF last Friday seems to be starting to breathe today after the last sessions in which the price has fallen inexorably. We can also see that EUR/USD today started the session with the USD in recovery, link in the description. As for this chart, we can technically analyze that the price has been in a rising trend for some time, just look at the rising lows and highs that appears today a rebound on a dynamic support / trendline, the price that has moved above the 200 average and that the stocastic seems to come out of the oversold zone with divergence. Bearish volumes seem to be decreasing. We await a new bullish impulse.

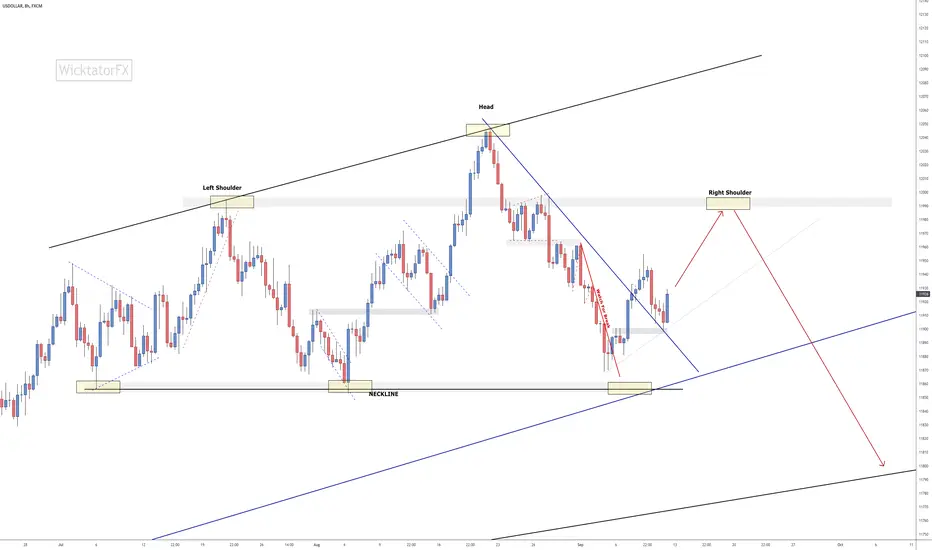
USDOLLAR - Head & Shoulders Reversal Soon!USDOLLAR is approaching a significant structure level which can also be the neckline for the bigger timeframe head and shoulder pattern, which is typically a reversal pattern.
Waiting for bullish price action at the neckline to then create the right shoulder. We can potentially take advantage of the bullish short term move by selling some XXXUSD pairs such as EURUSD and GBPUSD.
Goodluck and trade safe!
Bat on Dollar indexGBPJPY completed a butterfly and Dollar index a bat. Both complemented by a trendline touch
Might be a sign of a risk off move next week although a week of consolidation or just small correction also looks likely to me


Fail To Win- FAILED BULLISH TRADE ON DXYNow I'm learning to love my failures with trading because with them I find knowledge, advancement, and growth. Here on the 2h chart I placed a buy trade in a sellers market!! How hurt but happy I was to see it fail. Now on my weekly analysis for this pair, I analyzed price being bearish for the week. Why did I go bullish? Well, the overall market for DXY is bullish but price has now made it to strong supply area for a pullback. When I saw price hit a good demand area, I went for a buy in thinking it would take price higher. That was a lie. What I learned from this is to keep my bias from my higher timeframe perspective!! Always.

Fail To Win- Successful Bearish Trade on DXYTruly, I wanted to see this trade fail!! Since all my other trades do, I was expected to lose..but what gave me Hope was when price broke the HL and retested with a good bearish setup. I decided that in order for me to learn how to trade was that I have to not be afraid to fail on any trade. It is with this failure that I am able to re-analyze my trade to understand from a technical perspective on why the trade failed...but oh blessed be..the trade was successful! Failing to in order to win will be my success. In addition to this, I took a 1/1.5RR.

USDOLLAR Momentum Has shifted Up Into Jackson Hole SymposiumThe above chart shows the weekly FXCM USDOLLAR chart. We note that the higher trough followed by the higher peak has the greenback in uptrend. The momentum of this trend is defined by the gradient of the green trendline. However, we also note higher trough2 followed by higher peak2. These two points are defined by the orange trendline. I.e. the gradient has shifted upwards as the USDOLLAR’s momentum increased. We are heading into the Jackson Hole virtual symposium and market participants are looking forward to the Fed Chair’s delivery on Friday at 2:00pm GMT. The market will be listening for clues regarding the Fed’s tapering timetable and it will be interesting to see how this chart reacts, especially in relation to the steeper orange trendline.

FXCM Dollar Index @ Fib Confluence
Harmonic Gartley, Butterfly PRZ Level, hit-reacted on Weekly Closing basis.
Targets and Stop loss.

Us dollar Been following the usd for awhile as I trade mostly usd pairs, sniper entry caught with this trade.
reason for the buy is usd has been bullish for sometime possible long term buy.. But I'll close the trade once my tp is hit 1.22 Risk to reward.

USDOLLAR approaching key support, potential bouncePrice may bullish above pivot at 11899 in line with 61.8% Fibonacci retracement and 50% Fibonacci extension towards take profit at 11972 in line with 50% Fibonacci extension . On the other hand, price may bearish towards stop loss at 11880 in line with 78.6% Fibonacci retracement and 61.8% Fibonacci extension .
Any opinions, news, research, analyses, prices, other information, or links to third-party sites contained on this website are provided on an "as-is" basis, as general market commentary and do not constitute investment advice. The market commentary has not been prepared in accordance with legal requirements designed to promote the independence of investment research, and it is therefore not subject to any prohibition on dealing ahead of dissemination. Although this commentary is not produced by an independent source, FXCM takes all sufficient steps to eliminate or prevent any conflicts of interests arising out of the production and dissemination of this communication. The employees of FXCM commit to acting in the clients' best interests and represent their views without misleading, deceiving, or otherwise impairing the clients' ability to make informed investment decisions. For more information about the FXCM's internal organizational and administrative arrangements for the prevention of conflicts, please refer to the Firms' Managing Conflicts Policy. Please ensure that you read and understand our Full Disclaimer and Liability provision concerning the foregoing Information, which can be accessed on the website.
