TRYING TO TEACH MYSELF HOW TO FLOW WITH MARKET STRUCTUREHELPFUL MARKET FLOW DIRECTION AND ANALYSIS:
-I have an issue with trying to stay with flow of the market and placing trades in the appropriate direction. I would always sell when I need to buy and vice versa and realized that I did not understand market structure!
-Finally I decided to keep my attention to the swing highs/lows to help stay with current directional bias of the market.
-This was just one of the charts I was using as an control to see if my current mindset of directional bias was accurate and it was so.
-The texts on the chart should help my present and future in hope of becoming a consistent and knowledgeable trader.
USDOLLAR trade ideas

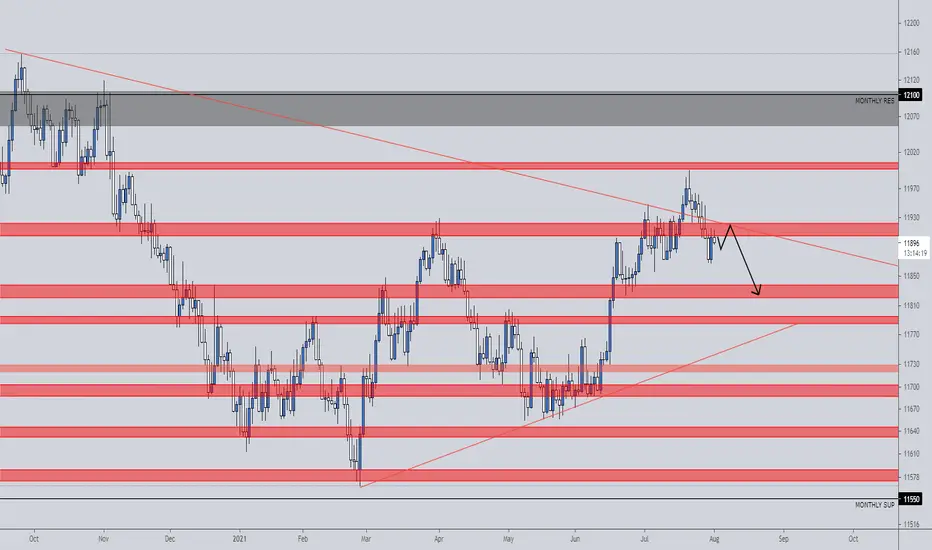
USDOLLAR Weekly Chart Trends Up As Market Anticpates TaperingThe above chart show’s FXCM’s USDOLLAR index on a weekly time scale and is reflective of the primary trend. Longer-term charts tend to align with the underlying fundamentals and here we can see a higher trough followed by a higher peak – the technical definition of an uptrend. The greenback is trending up as market participants start anticipating the tapering of Fed expansion. In this regard. last Friday’s NFP was a good number and the USD responded. The Fed is likely waiting for another NFP print before any policy change as last month’s number did not fully factor in the current wave of Covid-19 sweeping through the US, and which doesn’t seem to have peaked yet. We note that price never moves in a straight line and if the uptrend continues we will be monitoring for evidence of a zig-zag structure similar to the dashed red lines.

USDOLLAR(DXY) Trade OptionsBest possible view on the take of DXY by nasdaq diaries is to wait for market reaction at daily resistance. Descriptions are depicted on the chart. This is for both educational and investment purposes with keeping in mind the risk of trading CFDs based on a retail traders perspective.
Comment Like Share Follow

Ondas de ElliotConfirmando una compra en el Fibonacci, cumpliendo así la teoría de las ondas de Elliot

DXY D1 Bullish Not having a clear cut trend in the past weeks of the dollar index, we see some choppy movement with lots of momentum. Given the previous day close of a bullish candle (Friday), we can clearly see on naked price that the bullish bar violated both the high and low of it previous bearish candle. In most cases I tend to take that as a reversal signal. I'm expecting a little accumulation around this region and on the downside before seeing our rally up for the week. My eyes are on #GBPUSD and #EURUSD sells for this week heading to NFP

DXY DAILYWe closed the week with
- A bearish weekly engulfing candle
-Bullish daily engulfing candle
therefore
-On h4 we anticipate that slight pullback form some sort of a H&S pattern have shorterm buys to continue the daily bullish engulfing momentum and overally complete that weekly pullback for sellers to kick in and join the weekly momentum
DXY H4 PULLBACKWe closed the week with
- A bearish weekly engulfing candle
-Bullish daily engulfing candle
therefore
-On h4 we anticipate that slight pullback form some sort of a H&S pattern have shorterm buys to continue the daily bullish engulfing momentum and overally complete that weekly pullback for sellers to kick in and join the weekly momentum
USDOLLAR DXY Bearish, fib retracemnt, giant wedgeHey guys, this is just something i been looking at for the past couple months. I wanted to know your thoughts. Are you bearish or bullish on the dollar and why? Let me know! 🙏🏽

DOWJONES|USDOLLAR:WAIT.NEW BULLISH IMPULSE|UPTREND|LONG SETUP🔔After our previous Take profits on USDollar , today the charts show a new great opportunity...
Welcome back Traders, Investors, and Community!
Check the Links in Description and If you LIKE this analysis, Please support our page and Ideas by hitting the LIKE 👍 button
Traders, if you like this idea or have your own opinion about it, please write your own in the comment box . We will be glad for this.
Feel free to request any pair/instrument analysis or ask any questions in the comment section below.
Have a Good Day Trading !


Bulls losing momentum on the Dollar IndexI think long term US Dollar Index will be breaking down.
We are in a rising channel and it looks to be distribution because we are slowly rising and we reached and rejected nicely the resistance level. We have also taken out the previous highs.


USDOLLARIt appears the usd has some room to run still until it reaches a higher time frame resistance area. I expect a volatile week because of significant event risk. inflation and J Powell is on the docket. In my opinion. To start the week, I expect the dollar to continue to fall towards near term support. The usd is vulnerable under 11850.00,in my opinion, and may retest the main support lower down on a break down of said price level. In the event inflation comes in hotter than expected we may see a run up to test the " key price area" i have outlined. Then it all depends on Powell"s statement for the determination for a possible break out of the range or drop back down under 11850. Never the less, the upside seems limited, as there is, what appears to be strong resistance higher up.

USDOLLAR index Down temporarily?A nice rejection from the Daily descending trendchannel at a golden Fib lvl dorming a Double Top pattern
Price is near oversold and may drop to touch the 200 EMA before rising again
However returning below the trendchannel again would make us wait for reaction at the zone between 11740-11790
***Color coding***
Violet Monthly & Weekly
Red Daily
Blue Hourly
Grey LQ zone
***
Thanks for reading and safe trading everyone,,,

Sticky CirclesAn example of Fib circles exhibiting their "stickiness"
Price prefers to trend along the circle, rather than break out. Although this breakout will come, it finds it 'easier'
I'm not sure of the mathematical relationship that allows this, but it is common and I have seen it among many of charts published and during personal time
If anyone has insight please enlighten me
Two examples here the USDOLLAR and ZRXUSD

USDOLLAR [DXY] - should short now- Breakdown the trendline, broken the support line.
- Elliot targets actives short signal.
Good lucks.

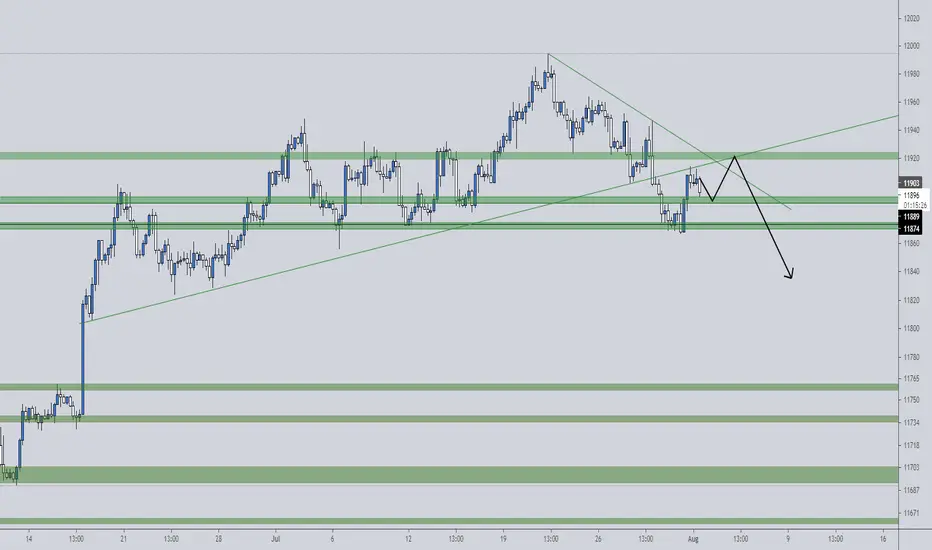
USDOLLAR Daily Likely To Run Into Near-Term ExhaustionPrice has deviated from trend significantly on the daily chart since last Wednesday's Fed statement release. Trend, in this case, referring to the peaks and troughs on the daily as defined by the green trendline. However, the massive momentum acceleration over the last week has seen the gradient steepen to orange and then to red. This is unlikely to be sustainable in the near term as it will require enormous market momentum to keep the red gradient steady. Market participants may succeed temporarily but it is likely that exhaustion sets as profits are banked. This will then set up the platform for the next potential leg higher. We refer to a similar market back in march as denoted by the black trendline.


USDOLLAR Showing Strength Ahead of Fed ReleaseFXCM's USDOLLAR index is in the bullish area on the daily chart on the left. The hourly EMAs and stochastic are in bullish mode and potentially align short-term traders with the daily. A movement of stochastic to 80 level and maintenance of that level (blue arrow) increase the chance of a successful trade. Trend following indicators may be useful in this case as a potential exit tool. Stop under hourly support in conjunction with risk management techniques is important. Please note volatility in this instrument is likely to increase tomorrow with the Fed release (6:00 pm GMT) and during the press conference (6:30 pm GMT).


USDOLLAR aka DJGday Guys. It's Friday.
Today we analyze USDOLLAR Index. The main reason we analyzing this pair, because we would like to know the current condition of USD Currency performance.
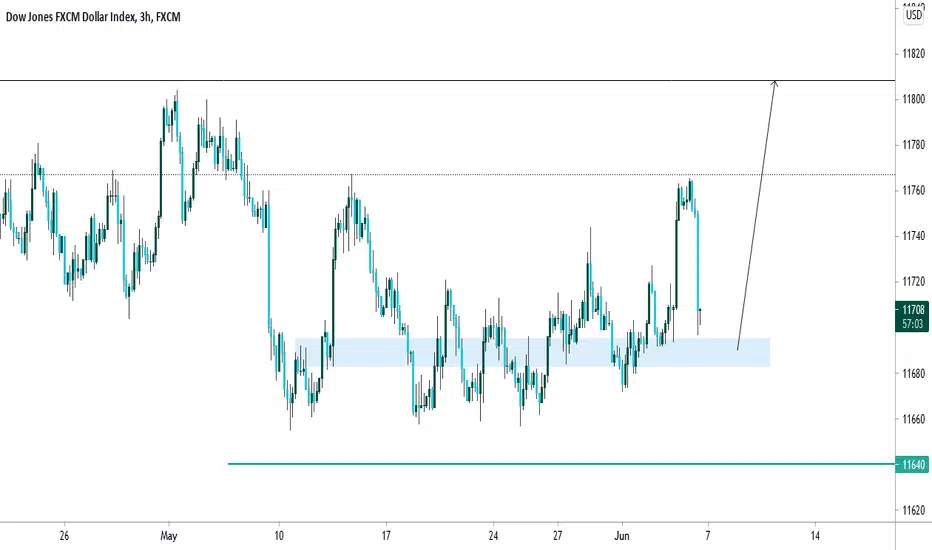
We see on the USDOLLAR or DJ at the moment, it was created an Extreme Demand Zone (EDZ) on May 10 at 11655. This the starting point bullish trend slowly build-up which is we getting confirmation that EDZ was tested and rejected three times on May 18, 21 & 25 at 11659. From here we getting more confirmation of the bullish trend.
Zoom in to Hourly Timeframe, We see a choppy Range EDZ at 11674 and ESZ at 11756 but clearly showing that bullish trend still in control. Currently, the price was inside of the LRZ, and the price movement creating a beautiful HiLow market structure.
What we projecting here is, the price will continue bullish which is the first target will be 11723 at MRZ, the next 11742 at URZ, and the Third at 11761 ESZ.
If this happens, most likely USD getting stronger and stronger. Based on recent NFP, fundamentally data release May data higher than April data. Here we able to see that the US economy is improving slowly.
If the USD gets stronger what gonna happen with XAUUSD, GBPUSD, EURUSD, USDJPY, USDCHF, USDCAD, AUDUSD, NZDUSD?
Let's see what happens next. Cheers
* Educational and Learning purposes only. No Buy/Sell recommendation. This is not investment advice.

USDOLLAR Bearish continuationLooking for continuation of bearish trend on the US dollar. Price last week created a signifcant lower low and has a high probability to drop and continue to the low. Looking for 3 potential situations including a very impulsive break of the low and continuation of the trade.

Bullish Forecast for the USDOLLARUSDOLLAR, Bullish H3
.
Khiwe
At this profile page, the shared analysis, ideas and also, the strategy of a chart belong to Khiwe with some being influenced. The technical set-ups are speculative, they are not guaranteed for accuracy or in completeness in the form of any content; -it is not to advice on financial markets. Please apply your own analysis and confirm it with price action.