Go Long on VIX: Predictions for Increased VolatilityCurrent Price: $16.41
Direction: LONG
Targets:
- T1 = $17.50
- T2 = $18.25
Stop Levels:
- S1 = $15.90
- S2 = $15.65
**Wisdom of Professional Traders:**
This analysis synthesizes insights from thousands of professional traders and market experts, leveraging collective intelligence to identify
No news here
Looks like there's nothing to report right now
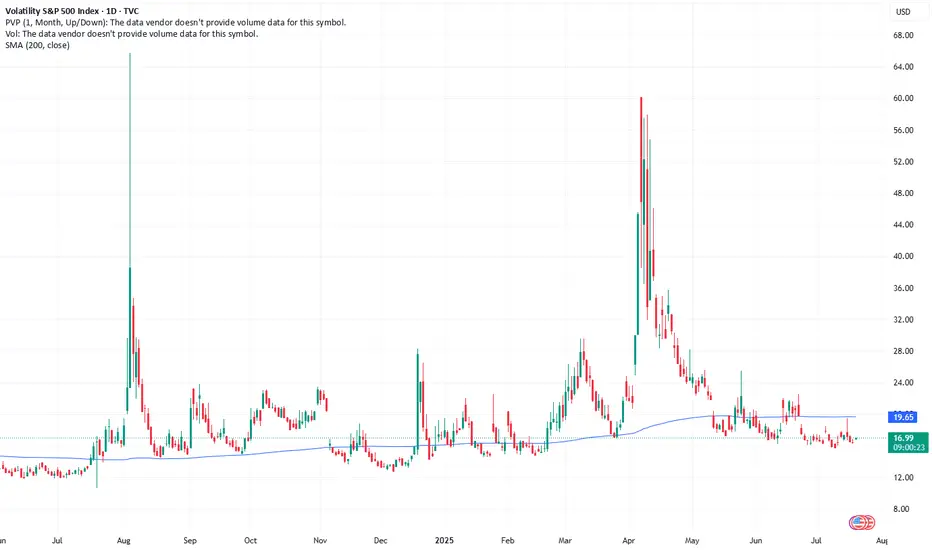
VIX possible long?As equity markets continue to approach all-time highs and expectations of interest rate cuts increase, market sentiment remains highly optimistic. This environment of "good news" characterized by strong performance in equities and the anticipated easing of monetary policy is likely to suppress volat
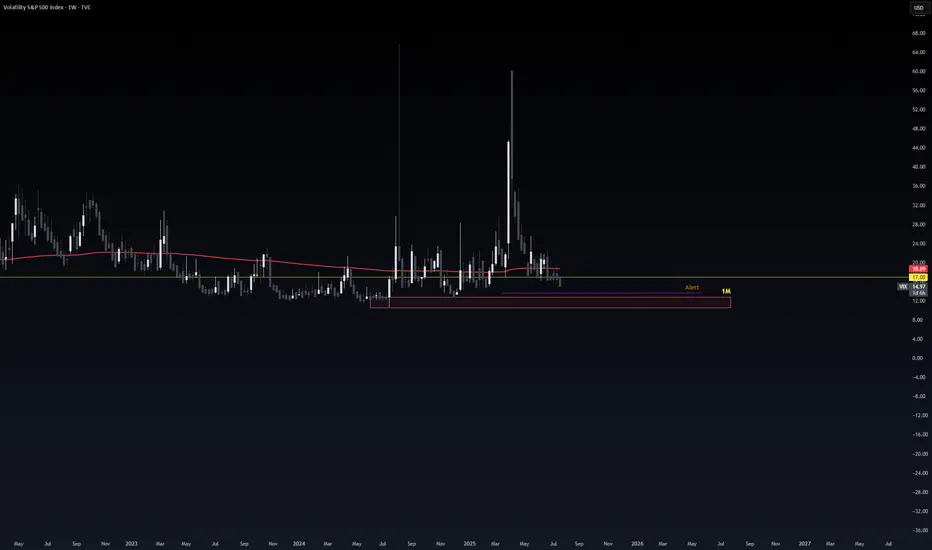
Weekly Volatility ReadGood Evening --🌗 🌕🌓
I hope everyone is having a relaxing weekend with friends and family alike because soon we will be in the thick of the price action again -- and it may get spicy! Let't us dive in as we review what happened last week and we look towards the next to trade range or observe.
The
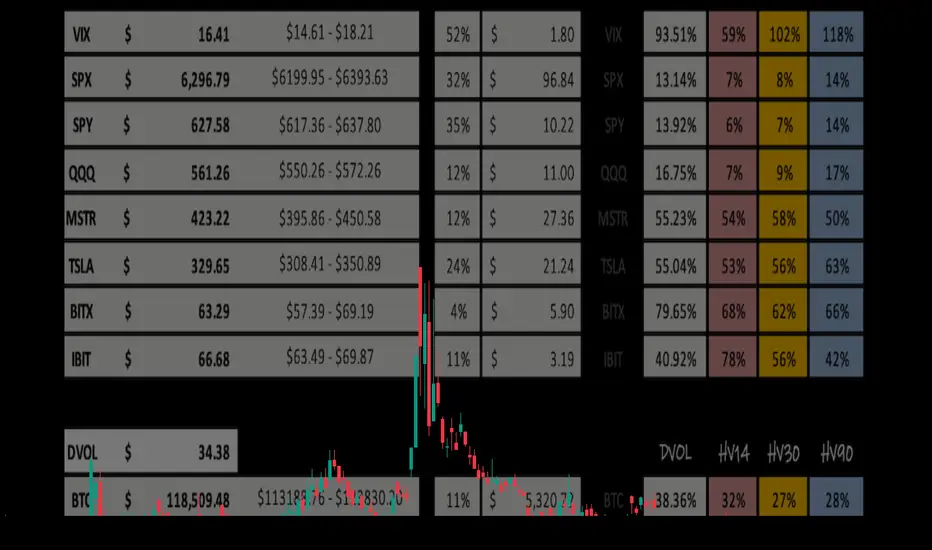
Weekly Volatility SnapshotGood Evening -- Happy July 4th to everyone
Let us review last week as we look towards the next in anticipation of the trade deal deadline that looms. I had a target on the SP:SPX of $6,253.59 and the weekly high was $6,284.65. The candle on the short week opened at its low of $6,019.21 and closed

How I Manage Risk (When Buying Options) If you’ve read my previous post — “How Much Risk Are You Really Taking?” — you already know my view on risk:
Treat every trade like watching your cash burn in front of you.
Ask yourself:
💭 “Would I be OK watching this much money disappear right now?”
If your answer is yes, take the trade and move on


Weekly Volatility Snapshot Good Evening --
I hope everyone is having a restful weekend and enjoying your time away from markets. Always appreciate it while you can, and spend that precious time with loved ones. Now, let us review the price action last week as we look towards our expectations for the coming trading sessio

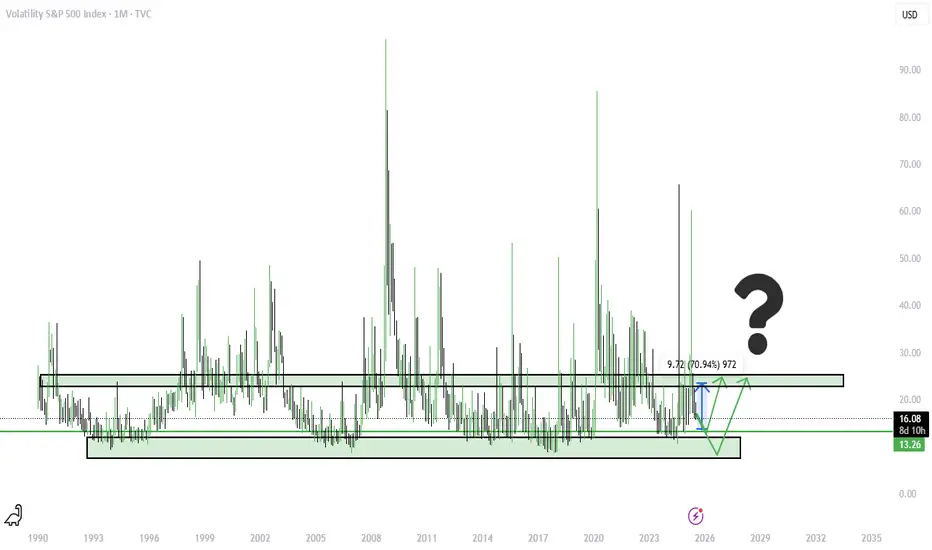
$VIX Volatility Extremes, Narratives, Booms & Busts!TVC:VIX volatility index extremes have always been an important factor when assessing the cyclical nature of financial markets.
I demonstrate in this chart what values and narratives to look out for at these extremes. This can help ignore the noise when buying during low social mood / fearful even


See all ideas
Displays a symbol's price movements over previous years to identify recurring trends.
Frequently Asked Questions
Volatility Index Future (VIX) reached its highest quote on Apr 7, 2025 — 45.760 USD. See more data on the Volatility Index Future (VIX) chart.
The lowest ever quote of Volatility Index Future (VIX) is 11.985 USD. It was reached on Dec 14, 2023. See more data on the Volatility Index Future (VIX) chart.
Volatility Index Future (VIX) is just a number that lets you track performance of the instruments comprising the index, so you can't invest in it directly. But you can buy Volatility Index Future (VIX) futures or funds or invest in its components.