✅VIX NEXT MOVE|SHORT🔥
✅VIX broke the key structure level
While trading in a strong downtrend
Which makes me bearish
And I think that after the retest of the broken level is complete
A rebound and bearish continuation will follow
SHORT🔥
✅Like and subscribe to never miss a new idea!✅
VOLX trade ideas

VIX Below Key LevelVIX is below the key long term support. Risk is back on for now. Not to see it will stay that way.

Stock Market Will Crash Next Week IMO.VIX divergence never lies. I think everybody we bought into stocks TODAY will have a rude awakening Monday IMO.

Make sure you add "Free Fallin'" to your playlist for Monday.AMEX:SPY
TVC:VIX
The VIX has a perfected Set up (9 Count) if it closes red today. The Fed might b!tch slap some sense into people next week. Until then, consider me a broke clock and a Negative Nancy.

$VIX is @ lower part of range$VIX is @ lower part of range
Still believe we're headed towards a big #stocks move within the next year
Direction?
$DJI & $NDX
Dunno, yet but we are almost @ top of ranges again
I know #VIX is for $SPX but never been fan #Index
$QQQ $DIA #QQQ #DJI

Volatility To Go Lower?We have a gap below that would provide a 3% scalp, most gaps do fill and we are pretty close at this point. IMO, there's a statistically good chance this could wick down or fill after hours but it's a good level to note. I'm thinking if we get there, it would be a good spot to reanalyze for a long position. Not financial advice, DYOR.

Expected Top Level of a potential VIX outbreakConsidering previous top levels of VIX outbreaks we can conclude that it reaches the apex around the 78.6 Fib-level. As the up-coming cycle down leg is the most anticipated since one can remember, I believe expectations to reach all time highs in VIX will be too much speculative - at least at the first attempt in the first quarter of 2023.

VIX looking attractive for a buy LongVIX is tricky to play, if you belive that more turmoil is coming next 6months.
This might be setting up for a good entry.
I would try to get a nice setup only if it hits my target of around 18, then we must identify a good
entry.
Subscribe for more trading ideas. Invest your money dont gamble it.

$SPX $VIX Upper Trend In-Tact Despite Lack of FearVolatility has been crushed with little fear showing, but has maintained the upper trend, bouncing where it needs to so far , weekly chart

VIX Diamond Garbaggio.Once you learn how the Wall Street Degens use the derivitives and VIX to basically legally wash trade and spoof you dont get surprised when diamond "reversal" patterns
Puke anyway to the original trend. A real diamond indeed... DXY same fate. Diamond Smiamond.

im not the first to say itif were going to hang out here below 20 and play with the idea of a recovery we run the serious risk of entertaining the inevitability of a second major wave in this corona island top/bear triangle. the new regime in volatility is either demanding we crush it, or we let it rip. we cant coil up like this forever. it might be super confusing, but ive laid out contingencies basically orbiting the general area targeting a breakout. i hope its not too dumbed down.
could uvxy for example relive recent exploits, or is it headed for 1:10 unit deletion ($50?) and then back to $5 (-90%?). this is the definition of an inflection point. all i know is theres a lot of units out there... they better start looking under rocks, in streams, up trees and in peoples underpants.

VIX is warning you of a big selloff coming soon ! It's appearing like a massive move in VIX is right around the corner. This means markets are going to selloff

Volatility is mean reverting. Big spike coming I've used an indicator called "bollinger band width" to make the case for a spike coming in VIX which should start sometime this week.

VIX-Low consolidating for upward price moveVIX is consolidating a bit longer at its trough, because so many cycles lining up. Such a phase of prolonged trough happened before as well. Indicators are in a phase to bottom out as well and we can expect an accellerated price movement upward during February/March most likely. The break-out of the green channel may therefore happen faster than anybody expects, but for a positioning it could be wise to wait a little bit longer and watch indicators to signal more strength.

Bullish VixInteresting bullish pattern presented on the Vix which is being followed by the RSI and an interesting bullish hammer in the DX1!

2008 Fractal But Not What You Think! @MelvinsMoves #spx #btc. This is a combo of two prior post I have made of the vix and spy fractal ... If this plays out then Idk .. its bearish
Pull down the indicators!!!! To See THE CHART

VIX Daily 01/23/2023In this chart of the VIX daily I have changed the final pattern to a Bullish Flagish pattern. I anticipate the VIX to rise also due to macro conditions, and Data Flow, and of course Earnings. Earnings I am back and forth on since Bank reporting..... Thats going to be a big tell IMO.
This pattern morphed since last week when I was calling it a more of a bullish triangle which I pointed out didn't make a lot of sense to me, as the FOMC is doing their darndest to hold back the market, and wqith all the PCE and other data dump this week I expected a rising VIX, not falling.


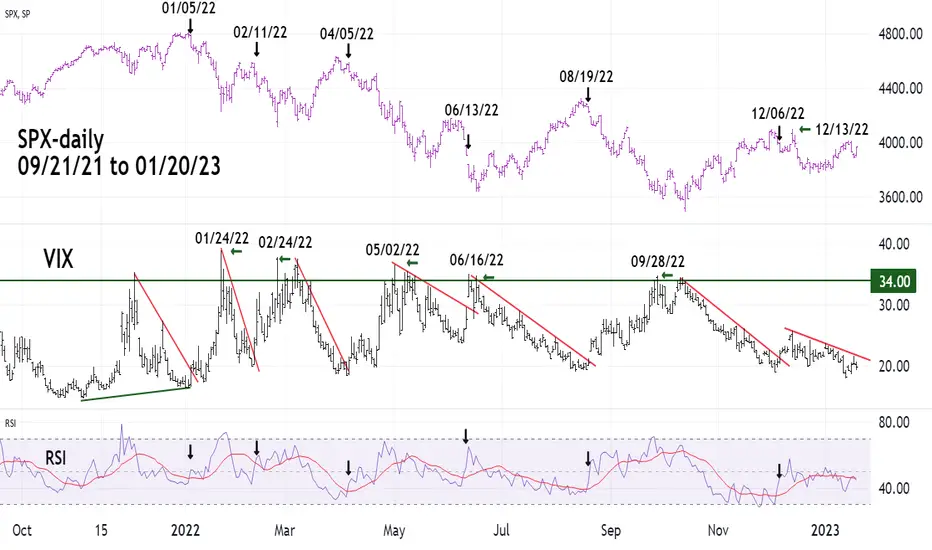
VIX and RSI - Top IndicatorMeasuring VIX with RSI gives effective signals for primary and intermediate S&P 500 (SPX) tops.
There are two factors to generate an SPX top signal.
1) Daily VIX breaking above its declining trendline.
2) Daily VIX – RSI breaking above its moving average line.
There’s a third factor in discovering primary SPX tops. Primary SPX tops usually occur with the daily SPX at a higher high and the daily VIX at a higher low. The most recent SPX primary top happened in January 2022. Note the VIX bottom in January was higher than the November 2021 bottom.
This phenomenon occurred at the SPX primary tops in 02/19/20, 09/21/18, and 01/26/18.
The factors to confirm a primary top are the same for intermediate degree tops.
There have been six top confirmation signals since January 2022.
They are as follows.
01/05/22
02/11/22
04/05/22
06/13/22
08/19/22
12/06/22
At the opening of the next trading day after a top signal is when to initiate SPX short trades.
The trade would be held until either the VIX exceeded 34.00 or the SPX is at a higher level than the short entry.
The VIX level to exit the short could be adjusted depending on recent VIX action, you want to find a general level in which VIX advances terminated.
The covering of SPX short trades would occur on the opening of the next trading day after VIX exceeded 34.00 or when the short trade is at a loss.
The six short exit signals with gain/loss are as follows.
01/24/22 gain 8%
02/24/22 gain 5%
05/02/22 gain 9%
06/16/22 gain 1%
09/28/22 gain 13%
12/13/22 loss -2%
Note the top signal on 06/13/22 came after a significant decline. The entry point on the next trading day was after a gap down. These two factors were warnings that the trade may not have been effective.
The trade after the 12/06/22 signal quickly became a loss.
Of the six signals since January 2022 – two were ineffective, a success ratio of 4/6 or 66%.
VIX Roadmap Oct 2022This whole pattern since late Jan looks like triangle consolidation and appears to be in Wave E before. If correct, Vix blow off coming

$VIX @ lower end of range, hard to call if it'll break$VIX is @ lower part of range
Daily :
Broke short trend, dotted line
Has positive divergence
-
Weekly:
Close to lower part of Symmetrical Triangle (will move fast in direction it breaks) White Lines, 2nd chart
TOO EARLY to call but #VIX teetering
#stocks $SPX #SPX #SPY $SPY

VIX VIX is viewed on stocks. so basically a support and resistance moves only.
Trade base on your decissions.
If you like my Ideas comment or suggest.
We keep growing, We learn everyday. IF you like it come and check me out.

Watch out for the VIXSince 2018, there is a support line on the VIX, and everytime those levels are visited, it goes up.
If it does, we are going to see uncertainity and prices go down, probably.
If it goes breaks the support line, there are high chances of a bullmarket.
