4 of C of B of 4Corrective channels in play with shadow channels shown in lighter shades for confluence discovery. Green and Red lines represent support and resistance respectively.
FXBTCJPY trade ideas


Sell btc when it for H&Slook at btc,it looks like it's gonna for h&S at resistance.
short it please tp 2700-3000

BTC still going down SO btc has been going down for weeks now and let me tell you this it is still going down and selling climax is yet to come.
everyone is talking about 3000$ line which is ofc strong and last friday it has rebounded about $200 and being stopped.
Now some of you may thought that it was rebound for trend to be ended but it is not!
you can see it has been stopped from 2 resistances which are the trendline and the line from last low price.
lets dump it more boys and girls, we about to short this bitch off!!! love btc

BTC ON FALLAs you can see btc has rebounded last night and some of you may thought that it is selling climax ald.
let me tell yall.
Selling climax isnt yet to come.
As yesterdays rebound was stopped at the resistance of two lines.(YELLOW AND GREEN)
this shit gonna pull over and go down


BTCJPY pretty clean daily chartBTCJPY more sell off to come as it breached the previous support zone.

Bitcoin's bloody aftermath update USD, GBP, EURO & JPYSo we got a new ATL for 2018
here are various fiat charts for reference on the weekly timeframe
no-one can really doubt we are now in a full bear market
to get OUT of bear market we need to move above these red trend lines of resistance which will not be easy!!
having huge success in our VIP prem group, join our free channel for more info
big up and peace be with you


SIMETRIC TRIANGLE on BTCYENThe Bitcoin / Yen chart, in a 3H timeframe has formed a symmetrical triangle . This pattern depends on the break, if the break is in the top line of the triangle it is recommended to open a long position, on the other hand, if the break is in the lower line of the triangle, open a short position.

Who let Batman Family out? Bitcoin on a Halloween Bull Breakout.Who let Batman Family out? Bitcoin on a Halloween Bull Breakout.

Multi Fiat charts on Bitcoin vs USD/EUR/GBP/JPYMulti fiat outlook for weekend of 20th October 2018
looking glum on the dailys all round
volume and momentum lacking, weekends we can see some big moves due to even less volume
we have see strong support at 6300-400 but will the bulls run out and the bears take over? if so obvious lows will be 6100, 5800 and 5400
im bullish on the hour chart and its changing very quickly, choppy waters for sure
lets hope the winter seansonailty kicks off the bull market properly, might be in early/mid November so good time to prepare and get ready
happy sailing!!


[BTCJPY] the Calm before the StormHello, This is D.VA.
Today's briefing is based on Japan exchange Bitflyer volume.
From 1 day chart, after VFI got into negative phase, it has shown inverse Head and Shoulder Pattern which shows an accumulation.
Since it brokethrough strong resistance, we prospect positive movement in longterm perspective.
However, due to not enough retracement and the formation for ascending broadening wedge pattern, we still open the probability for correction.
Since the price approached to the edge, it might show a big movement soon.
Investing strategy is same. Operate 30% of our asset to accumulate such as GRS, and be prepared for a sudden drop.
Hope you have a great day^^


FXBTCJPY longAccording to signal of my strategy, FXBTCJPY long with Trailing step.
This is late entry because I've cheked it before, however it is still in gain.
NOTE on my dP Engineered startegy:
dP Eng
This strategy is based on volumes and Bill Williams indicators.
The idea is simple:
- if price has enough boost then follow the trend
- if the boost is slowing down then bet on trend reversal
Results are very good: look at maximum drawdown and percent profitable.
If you are intested on this strategy, I devoleped also the study with alarms.

BTC about to crash*** THIS IS NOT AN ADVICE, DO YOUR RESEARCH AND TRADE WITH YOUR OWN RESPONSIBILITY***
Typical Descending Triangle
Target 3,000 USD or 310,000 JPY
*** THIS IS NOT AN ADVICE, DO YOUR RESEARCH AND TRADE WITH YOUR OWN RESPONSIBILITY***

[Red Apple] " short briefing for BTC on BITFLYER " _ 18.08.07I guess there's nothing special compared with previous briefing. so, here is short briefing for BTC on BITFLYER.
1. Short Briefing
a. Breakout of Flag pattern.
b. Breakout of up-trend line -> focus on closing price on daily chart
c. Moving between Fib. 0.5 ~ 0.618
At the moment, many conditions are not so good for going up. Breakout of many support lines and Heading down all EMAs.
2. Expectation
It can move like above chart.
even it goes down, it can be supported from yellow box.
3. Countermeasure
a. Down
if you bought BTC using A Cypher or trend line, strictly keep your stop-loss. if you trade from BITFINEX, there is still a gap to trend line. if it is broken, just be careful.
b. Up
Focus on penetrate of 20EMA and 0.5 Fib.
4. Summary
the chart on BITFLYER is working quite good in terms of Fibonacci, trend line and etc,. maybe it does because of BTC dominance(always 1st or 2nd rank). In this reason, BTC on BITFLYER was introduced in this briefing.
(For your reference, now, 1st rank BitForex 41.67% 2nd rank BITFINEX 12.42% 3rd rank BINANCE 5.24%)
Actually, i think it is not so good to check many charts from different markets. but it is good to understand more precisely BTC market' position.
This is end of this briefing and if found something from the market, i'll try to give comments.
If you got help from my briefing, click "+Agree, +Follow".


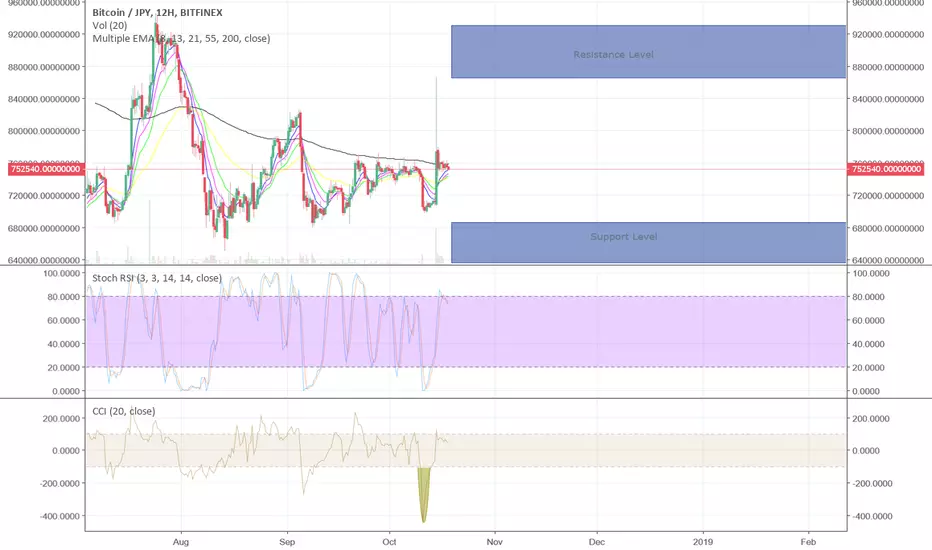
BTC/JPY Daily Trend AnalysisPrice touches the strong support line and form a head and shoulder pattern,price direction changes to Bullish trend going to the resistence line.
For new entries, wait to a pullback to make a entry and good lucky!

[Red Apple] "move move..... " _ BTC/USD _ 18.07.23Still move sideways for days. Let's start the analysis for today's BTC/USD chart.
If you are busy, you can just read below briefly
'1. Briefing '
'6. Summary and Strategy'
and click '+Thumb up, +Follow' :-)
1. Briefing
# Possibility to penetrate down-trend line by Sideways Movement
# Need to break 100EMA for day
# Need to break 20EMA Resistance for week
# Need to break resistance of Neck-Line on Bitflyer market
2. Weekly Chart
1) Trend
Re-entering over up-trend line
2) Candle
Bullish Engulfing Candle
3) Main Price
if the price keeps over 50% of candle in this week, it can be moved up more
4) EMA
exactly touched 20EMA(red) for week and going down -> After dramatically falling into the bottom in the end of January, weekly candles was never being located over 20EMA continuously -> Therefore, focus on breakthrough weekly 20EMA or additionally going down.
3. Daily Chart
1) Trend
Support trend line(blue line) on log chart.
2) Candle
Doji candle
3) EMA
a. 100EMA(orange) is continuously worked as resistance
b. 20EMA(red) and 50EMA(purple) will be crossed soon.
4. 4H
1) Trend
Move sideways after re-entering into up-trend line
2) EMA
worried about closer distance between 20EMA(red) and candle. Now keep retesting 20EMA
3) Pattern
Nothing special. just move inside of the box
4) Indicators
Band range became narrow due to moving sideways. possible to trade for a short term using Bollinger band but should be careful it can be broken
5) Fibonacci
Heavy accumulated volume range 0.382 ~ 0.5
5. Etc.
Let's check the chart applying ichimoku cloud on BITFLYER market. As you can see if the candles keep moving sideways, legging span will be faced with the resistance and coincidentally a candle will be met down-trend line. Also, 2days later, it can be out of cloud. To sum up, if it moves sideways, there will be big movement between 2 and 9 days later.
I thought it is quite interesting so introduce this view. just see this as a reference. do not have blind faith in Indicators. Act correctly case by case.
6. Strategy and Summary
Almost same as previous briefing.
Bullish View
1st Target : penetrate 100EMA for day
2nd Target : breakthrough Neck-Line on BITFLYER and penetrate 20EMA for week
When it is done, it can be moved up a lot
Bearish View
I expected market correction will be done at least to Fib. 38.2% (about $6800) and heavy resistance is existed upper side. Therefore, should be careful always before meet the targets in Bullish View
If you think my idea is helpful for you, Click '+Thumb up, +Follow' :)
If found something special, i will comment in real time
