DXY trade ideas

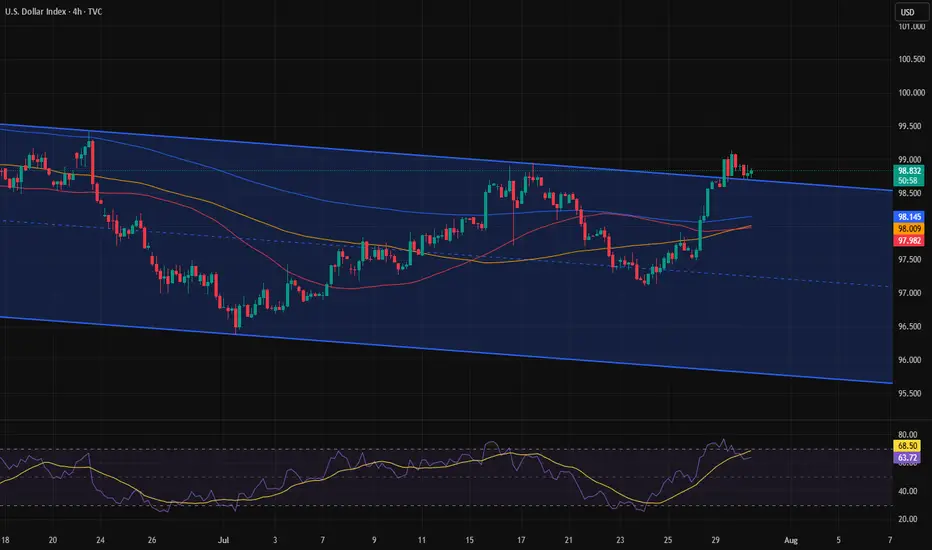
US dollar index (DXY) still looks weakAfter finding resistance near my 50-day EMA on the daily chart, TVC:DXY is now showing signs of continued weakness. Let's dig in.
MARKETSCOM:DOLLARINDEX
Let us know what you think in the comments below.
Thank you.
75.2% of retail investor accounts lose money when trading CFDs with this provider. You should consider whether you understand how CFDs work and whether you can afford to take the high risk of losing your money. Past performance is not necessarily indicative of future results. The value of investments may fall as well as rise and the investor may not get back the amount initially invested. This content is not intended for nor applicable to residents of the UK. Cryptocurrency CFDs and spread bets are restricted in the UK for all retail clients.

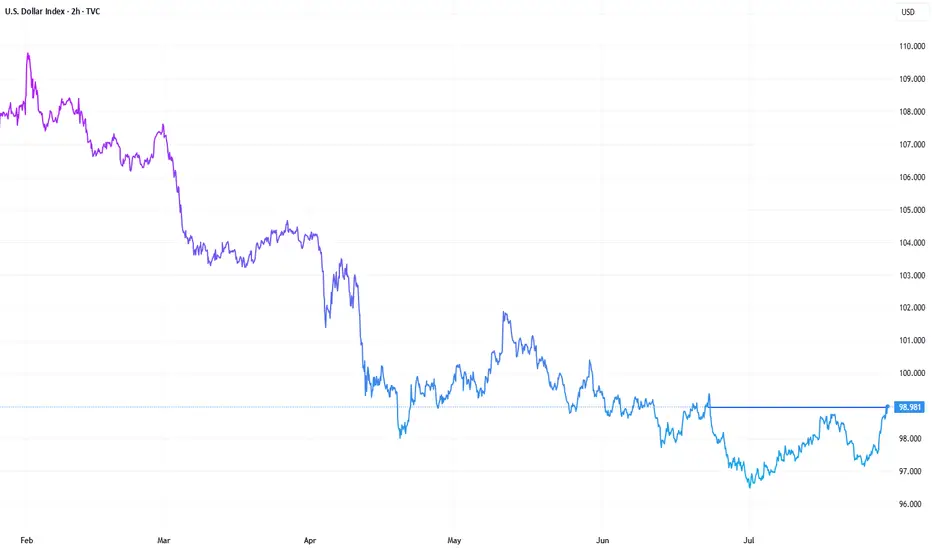
US Dollar Breakdown – Don’t Fight the FloodSince the start of the year, after forming a small double top around the 110 zone, the US Dollar Index (DXY) has followed only one direction: down.
So far, we’re seeing a decline that’s approaching 15%, with the index breaking multiple major support levels along the way. And judging by the current structure, there’s little reason to believe this trend will reverse any time soon.
________________________________________
🔍 Short-Term View – Flag Break, More Losses Ahead
Zooming in, we can observe that the last rally was purely corrective — a typical bear flag formation. That flag is now broken to the downside, which confirms renewed bearish pressure and suggests that further losses are likely even in the short term.
________________________________________
🎯 What’s Next?
The next major support zone sits around 95, a level that should act as a magnet if the current trend continues.
As long as price stays under 100 ZONE, the outlook remains bearish and the strategy should align with that bias.
________________________________________
✅ Strategy Going Forward
The safe and logical approach now is to buy dips on major USD pairs:
EURUSD, GBPUSD, AUDUSD, and NZDUSD
________________________________________
📌 Final Thought
The structure is clear, momentum favors the downside, and the market is offering clean setups across multiple USD pairs.
Don’t fight the trend — follow the flow. 🟢

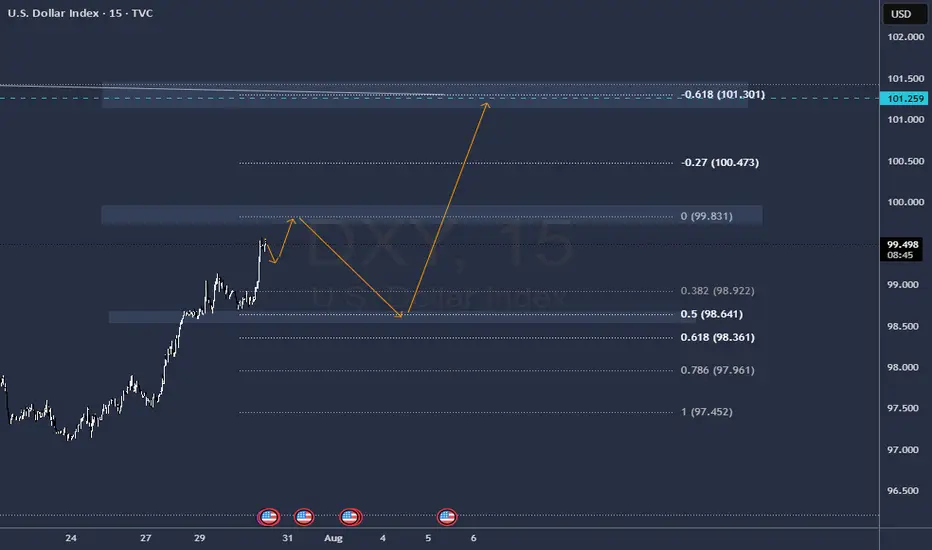
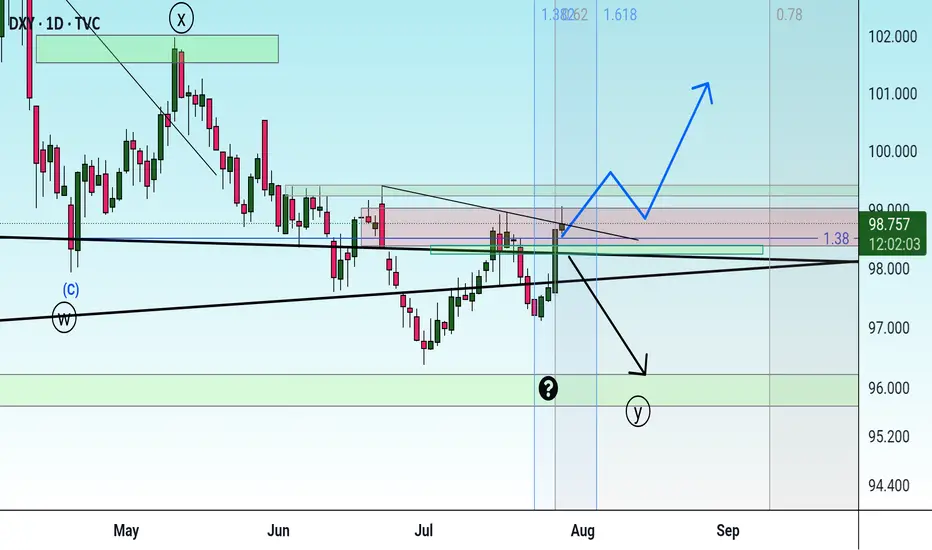
DXY – The Trap Is Set. The Drop Is Coming.Wave structure complete.
Retail thinks we’re going up. I know where it’s really going.
This is GreenFire Execution, not prediction.
🧠 Final liquidity hunt possibly toward 98.76 or even 101.40, then lights out.
Targeting the big liquidity pocket at 95.215
That’s where legends buy while the crowd panics.
📐 Elliott Wave | Wedge Mastery | Market Psychology
If you understand this chart — you don’t need signals. You need silence and execution.
#DXYSetup | #Wave5Ready | #SmartMoney | #ForexMillionaire | #TradingViewElite

DXY BULLISHWe sitting on a trendline third touch and also in confluence with a 61.8% level once we hold we should see a takeoff or highest we dump into $94 then we takeoff

DXY 8H – Rejected Key Resistance, Can the Dollar Bounce Back?The U.S. Dollar Index (DXY) just got rejected off a key 8H supply zone near the psychological 100 level — failing to reclaim a level that previously acted as major support. With EMAs flattening and macro uncertainty rising, the dollar’s next move will have big implications across global markets.
🔹 Price Structure
The $100–$101.50 zone acted as support for months before breaking — and DXY just got rejected on its first retest.
The next resistance levels are stacked at $104, $108, and $110, each tied to prior breakdown points and macro peaks.
If DXY can't reclaim $100, a slide toward EMA support at ~$98 or even new lows remains in play.
🔹 EMA Signals
Price currently hovers between the EMA 50 and EMA 100 — an indecision zone often preceding trend continuation or reversal.
A breakdown below both EMAs would confirm momentum is stalling, while a reclaim of $100 could reignite the bullish push.
🔹 Implications for Risk Assets
If the dollar weakens from here, we could see renewed upside in crypto and equities.
Conversely, a reclaim and surge toward $104+ would likely pressure risk-on markets.
Is the DXY topping out — or just gearing up for another leg higher?
Let’s talk macro 👇

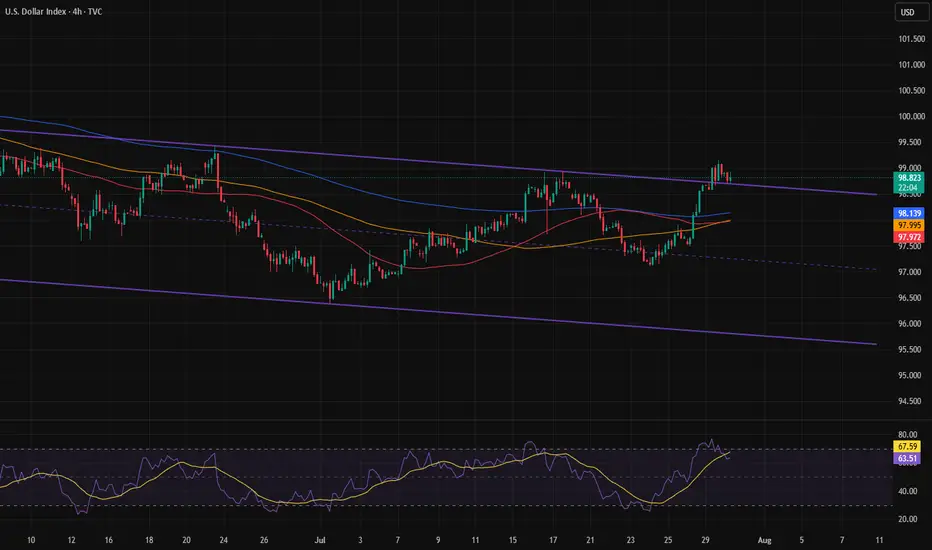
Breakout from the channel again?After a long period of ranging, the DXY finally managed to break the range's ceiling last week and even gave us a channel confirmation afterward. But if you remember, there were several major news events last week, with the last one on Friday causing the price to fall back into the range. Now we can see that an ascending channel has formed inside the range, and the price is currently at the bottom of that channel. If it manages to break out of the channel again, there’s a chance that this time the trend might truly reverse.
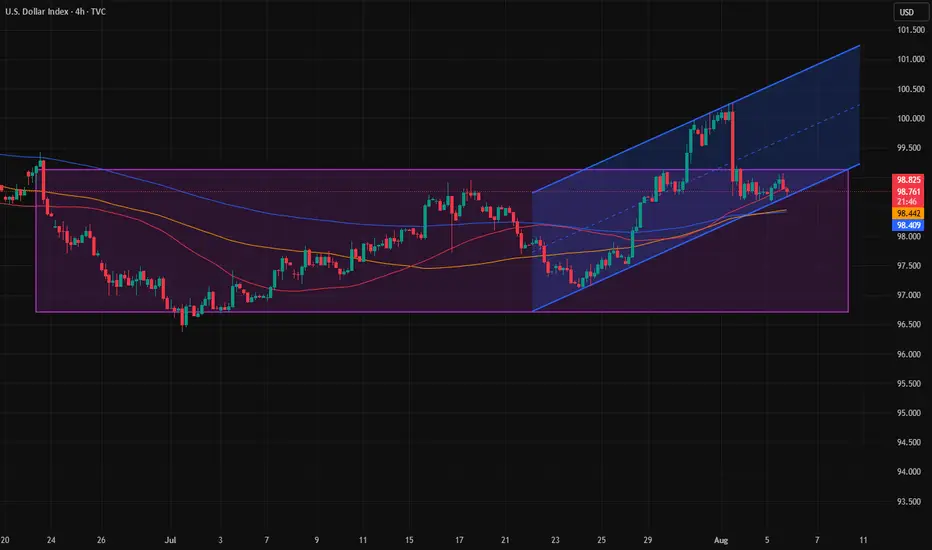
Just a bounce off or a real trend reversal?DXY sits on a major support zone. Price often delivers a reflex bounce at strong levels before continuing the prevailing trend, so a quick pop isn’t proof of a new bull run. DXY is closely linked to US real yields (10y TIPS): if real yields roll over as the Fed eases, USD strength likely fades; if real yields stay firm, a durable reversal is more plausible.
This post is for informational/educational purposes only and is not investment advice or a solicitation to buy/sell any security. Past performance is not indicative of future results. I may hold positions related to the instruments mentioned.
DXY UPDATE FOR LONG as we forecast a long term this an update
The dollar index (DXY00) on Tuesday rose by +0.22% and posted a 5-week high. The dollar has carryover support from Monday following the EU-US trade deal that is seen as favoring the US. Also, expectations for the Fed to keep interest rates unchanged at the end of Wednesday's 2-day FOMC meeting are supportive of the dollar. The dollar extended its gains after the US Jun advance goods trade deficit unexpectedly shrank, a supportive factor for Q2 GDP, and after July consumer confidence rose more than expected.

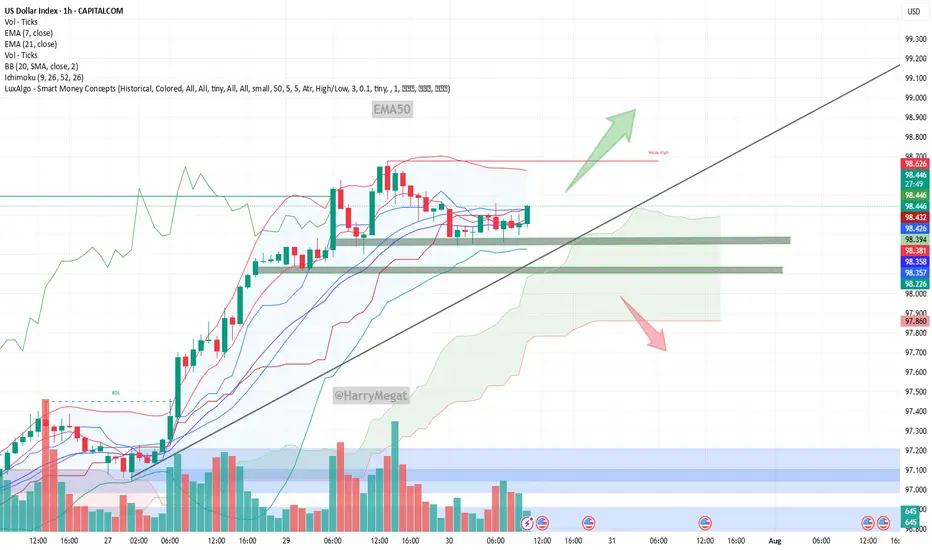
US Dollar Index (DXY) Chart Analysis – 1H TimeframeUS Dollar Index (DXY) Chart Analysis – 1H Timeframe
This chart shows the **US Dollar Index (DXY)** with key price zones, trendlines, and EMA indicators. Here's a detailed analysis:
**Key Observations:**
* **Price:** Currently trading near **98.41**
* **EMAs:**
* **EMA 7** = 98.373 (short-term trend)
* **EMA 21** = 98.356 (medium-term trend)
* **Trendline:** Uptrend line still intact, acting as dynamic support
* **Volume:** Steady, no strong breakout yet
* **Support Zones:** 98.20 – 98.35
* **Price Structure:** Consolidating above support and EMAs after a pullback from highs
**Bullish Scenario**
* If price **holds above EMAs and the green support zone (98.20–98.35)**
* **Breakout above 98.50** would confirm strength
* Targets:
→ **98.70**
→ **99.00+** if trendline support continues to hold
* EMAs are aligned bullishly (7 above 21) – good sign for continued upward trend
**Bearish Scenario**
* If price **breaks below 98.20 and closes under the trendline**
* Watch for rejection near 98.50 followed by strong red candle
* Downside targets:
→ **97.80**
→ **97.60**
* A breakdown below the ascending trendline = trend shift confirmation
**Conclusion**
* **Bias:** Bullish as long as DXY stays above 98.20 and trendline
* **Invalidation:** A break and close below 98.20 + trendline = bearish shift
Correction and rise, or drop?Today, with the first news release, we'll see whether the Dollar Index is making a correction before continuing upward, or if it's going to drop and fall back into the channel.
Waiting for tomorrow.The entire market is waiting for the major news that will be announced one after another starting tomorrow.
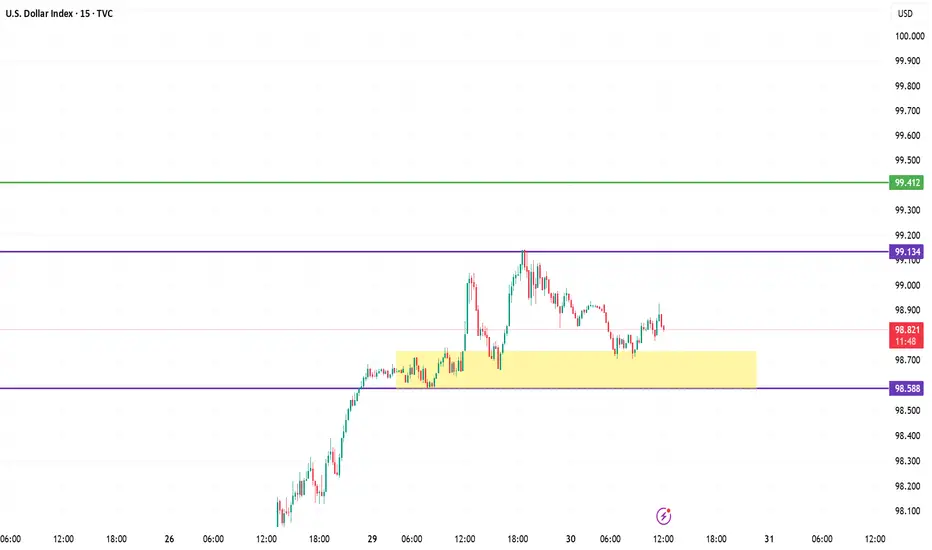
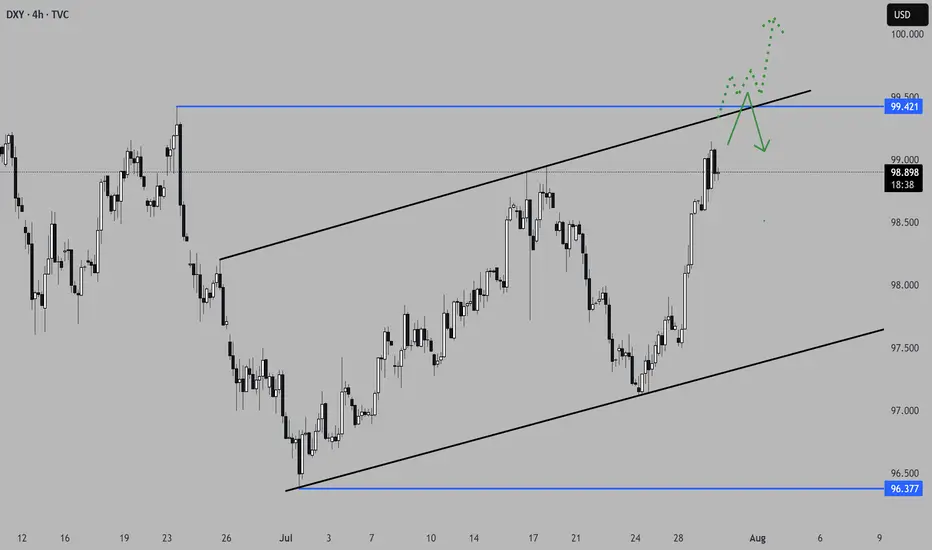
U.S. Dollar Index (DXY) – July 30, 2025 | 15-Min Chart1. **Range-Bound Structure**
DXY is consolidating between 98.588 support and 99.134 resistance. The 98.68–98.74 zone has acted as demand, but repeated retests show weakening buyer interest.
2. **Failed Breakouts**
Multiple rejections at 99.134 indicate it's a trap zone where sellers absorb buy-side pressure.
3. **Bearish Momentum Signs**
Lower highs and wicks into resistance with weak closes suggest distribution. Momentum likely shows bearish divergence.
4. **Critical Levels**
* **Support:** 98.588 — a break below this opens downside potential.
* **Resistance:** 99.134 — bulls need a strong breakout above this for continuation to 99.41+.
Summary:
Sellers dominate below 99.134. If 98.588 breaks, expect bearish continuation. Only a confirmed breakout above 99.134 shifts bias bullish.
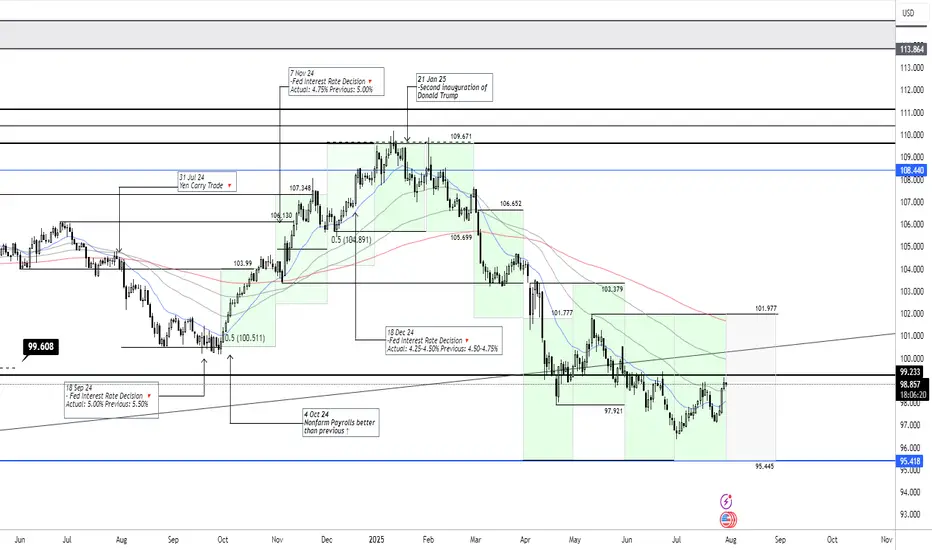
DXY July 30 2025The US dollar remains within the projected trading band, and we expect it to continue fluctuating within this range over the coming month.
Monthly Target: 95.445-101.977
Interesting few days ahead... USD pairs approaching key levelsDXY is finishing a HTF consolidation and is approaching medium-term key areas. Other USD pairs are also in areas where they could aggressively turn around. EURUSD just finished a H4 3-touch continuation flag and is starting to stall on the 3rd touch, suggesting indecision in the markets.
Considering the news events in the next 3 days, starting today with USD advanced GDP data, we could see volatility kicking in on these key levels. We do need a catalyst to push price into a larger directional move, and we are prime positioned for the next leg. Technically, a breakout in both directions would make sense in these areas. Time to set alarms and be vigilant but not jump into trades too early, considering NFP on Friday as well.
*** **** ****
📈 Simplified Trading Rules:
> Follow a Valid Sequence
> Wait for Continuation
> Confirm Entry (valid candlestick pattern)
> Know When to Exit (SL placement)
Remember, technical analysis is subjective; develop your own approach. I use this format primarily to hold myself accountable and to share my personal market views.
The pairs I publish here are usually discussed in detail in my Weekly Forex Forecast (WFF) and are now showing further developments worth mentioning.
⚠ Ensure you have your own risk management in place and always stick to your trading plan.
*** **** ****
Dollar is bullish Price was previously bearish, formed an inverse head and shoulders pattern. Broke out of the neckline. Wait for retest in combination of a bullish candlestick pattern and long.

US Dollar Index: Down YTD, But at a 5-Week HighThe U.S. dollar plays a leading role in the performance of U.S. stocks versus international stocks. The greenback endured its worst first-half performance since 1973, helping ex-U.S. equities post massive absolute and relative gains through June. But could the narrative be shifting? And what might it mean for investors?
The U.S. Dollar Index (DXY) sits at a five-week high ahead of the July Federal Reserve interest rate decision and the key July jobs report to be released on August 1. Up four sessions in a row, the dollar appears poised to post its best month since last December (in fact, the DXY's first positive month of 2025). If it’s the start of a protracted recovery, then the “U.S. exceptionalism” trade could be back in vogue over the second half, resulting in the same old story of U.S. over international in the stock market.
Possibility of uptrend As long as the indicator is above the green resistance zone and the resistance trend line is not consolidated, the continuation of the downtrend is likely. If the strong indicator breaks through the mentioned resistance zone, a long-term uptrend will be formed.
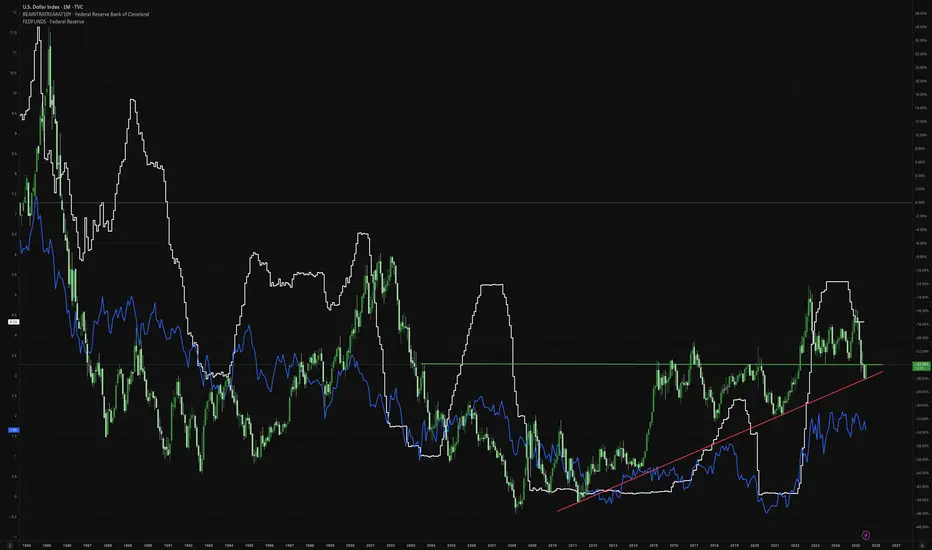
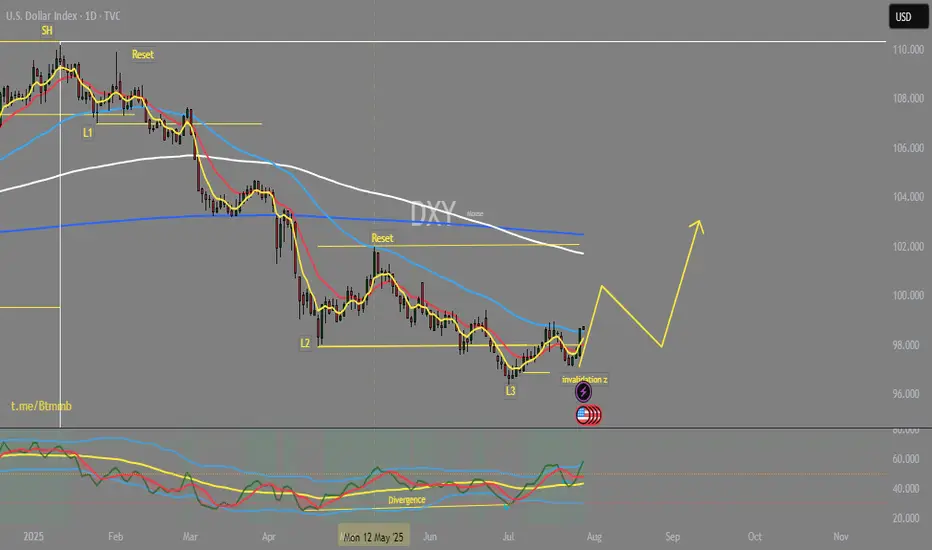
DOLLAR RECOVERYIt is been so down from begin of this year almost and now it is a time for the bulls to catch some breath. The cycle show that we are in the reset phase after the three levels down, which is gonna last until August 15 where we expect another fall.
DXY LOCAL SHORT|
✅DXY is going up now
But a strong resistance level is ahead at 98.948
Thus I am expecting a pullback
And a move down towards the target of 98.451
SHORT🔥
✅Like and subscribe to never miss a new idea!✅
Disclosure: I am part of Trade Nation's Influencer program and receive a monthly fee for using their TradingView charts in my analysis.

DXY dont take these charts serious its just my way to keep myself entertained while finding levels etc.. no your usual boring systematic shiiiteee!! IRISH CRAIC ONLY!!! ☘

Dyx us dollar I think the US dollar will fall sharply, causing a sharp rise in gold. There will probably be a bigger fall than in 2008 in the global economy, especially in the US.
