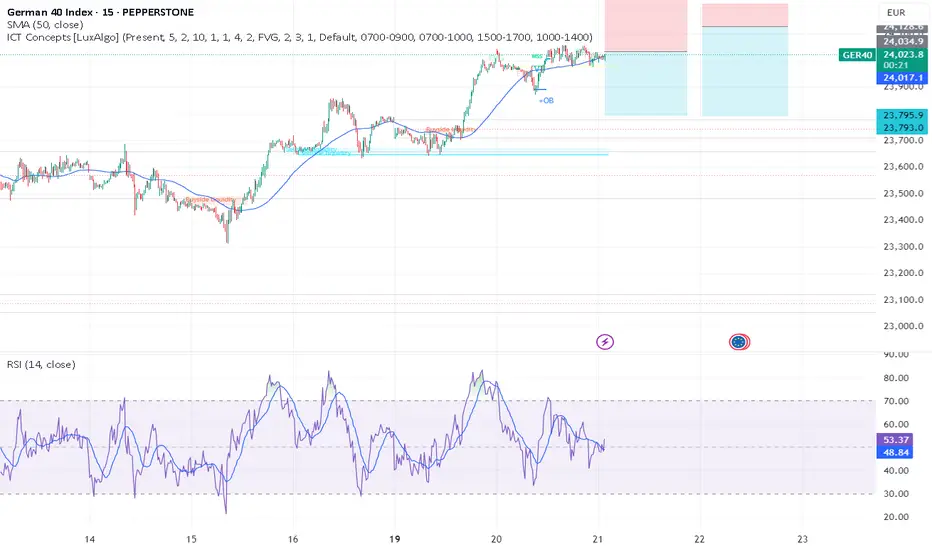
GER40 (BOS + OTE + Supply)Hello Traders!
Now we see big volume, BOS + Supply + OTE.
Target till 0.5 global fib level.
Have a profitable day and don't forget to subscribe for updates!
GDAXIM trade ideas

ger30Looks like a big liquidity grab to the downside in turn to continue to the up side
A Tap on to the OB would be an ideal Opportunity IMO
#GER30
Xauusd

GERMANY 30 LONG looking at continuation of current buy trend on Germany 30... Tell me what you think

DAX WILL KEEP GROWING|LONG|
✅DAX made a retest of
The horizontal support level
Of 23,371 and the index is already
Making a bullish rebound so we
Are bullish biased and we will
Be expecting further growth on Monday
LONG🚀
✅Like and subscribe to never miss a new idea!✅
Disclosure: I am part of Trade Nation's Influencer program and receive a monthly fee for using their TradingView charts in my analysis.

DE40 / GER40 "Germany40" Index Market Bullish Heist Plan🌟Hi! Hola! Ola! Bonjour! Hallo! Marhaba!🌟
Dear Money Makers & Robbers, 🤑 💰💸✈️
Based on 🔥Thief Trading style technical and fundamental analysis🔥, here is our master plan to heist the DE40 / GER40 "Germany40" Index Market. Please adhere to the strategy I've outlined in the chart, which emphasizes long entry. Our aim is to escape near the high-risk Red Zone Level. Risky level, overbought market, consolidation, trend reversal, trap at the level where traders and bearish robbers are stronger. 🏆💸"Take profit and treat yourself, traders. You deserve it!💪🏆🎉
Entry 📈 : "The vault is wide open! Swipe the Bullish loot at any price - the heist is on!
however I advise to Place buy limit orders within a 15 or 30 minute timeframe most recent or swing, low or high level. I Highly recommended you to put alert in your chart.
Stop Loss 🛑:
📍 Thief SL placed at the recent/swing low level Using the 4H timeframe (22250.0) Day/Swing trade basis.
📍 SL is based on your risk of the trade, lot size and how many multiple orders you have to take.
🏴☠️Target 🎯: 24700.0 (or) Escape Before the Target.
🧲Scalpers, take note 👀 : only scalp on the Long side. If you have a lot of money, you can go straight away; if not, you can join swing traders and carry out the robbery plan. Use trailing SL to safeguard your money 💰.
💰💵💸DE40 / GER40 "Germany40" Index Market Heist (Swing Trade Plan) is currently experiencing a neutral trend there is high chance for bullishness,., driven by several key factors. .☝☝☝
📰🗞️Get & Read the Fundamental, Macro economics, COT Report, Geopolitical and News Analysis, Sentimental Outlook, Intermarket Analysis, Index-Specific Analysis, Positioning and future trend targets with Overall Score..... go ahead to check👉👉👉🔗🔗🌎🌏🗺
⚠️Trading Alert : News Releases and Position Management 📰 🗞️ 🚫🚏
As a reminder, news releases can have a significant impact on market prices and volatility. To minimize potential losses and protect your running positions,
we recommend the following:
Avoid taking new trades during news releases
Use trailing stop-loss orders to protect your running positions and lock in profits
💖Supporting our robbery plan 💥Hit the Boost Button💥 will enable us to effortlessly make and steal money 💰💵. Boost the strength of our robbery team. Every day in this market make money with ease by using the Thief Trading Style.🏆💪🤝❤️🎉🚀
I'll see you soon with another heist plan, so stay tuned 🤑🐱👤🤗🤩

DE40 / GER40 "Germany40" Index Market Heist Plan (Day Trade)🌟Hi! Hola! Ola! Bonjour! Hallo! Marhaba!🌟
Dear Money Makers & Robbers, 🤑 💰💸✈️
Based on 🔥Thief Trading style technical and fundamental analysis🔥, here is our master plan to heist the DE40 / GER40 "Germany40" Index Market Heist. Please adhere to the strategy I've outlined in the chart, which emphasizes long entry. Our aim is to escape near the high-risk ATR Line Zone. It's a Risky level, overbought market, consolidation, trend reversal, trap at the level where traders and bearish robbers are stronger. 🏆💸"Take profit and treat yourself, traders. You deserve it!💪🏆🎉
Entry 📈 : "The heist is on! Wait for the Crossing previous high (22600) then make your move - Bullish profits await!"
however I advise to Place Buy stop orders above the Moving average (or) Place buy limit orders within a 15 or 30 minute timeframe most recent or swing, low or high level for Pullback entries.
📌I strongly advise you to set an "alert (Alarm)" on your chart so you can see when the breakout entry occurs.
Stop Loss 🛑: "🔊 Yo, listen up! 🗣️ If you're lookin' to get in on a buy stop order, don't even think about settin' that stop loss till after the breakout 🚀. You feel me? Now, if you're smart, you'll place that stop loss where I told you to 📍, but if you're a rebel, you can put it wherever you like 🤪 - just don't say I didn't warn you ⚠️. You're playin' with fire 🔥, and it's your risk, not mine 👊."
📍 Thief SL placed at the nearest/swing low level Using the 4H timeframe (21700) Day trade basis.
📍 SL is based on your risk of the trade, lot size and how many multiple orders you have to take.
🏴☠️Target 🎯: 24000
🧲Scalpers, take note 👀 : only scalp on the Long side. If you have a lot of money, you can go straight away; if not, you can join swing traders and carry out the robbery plan. Use trailing SL to safeguard your money 💰.
💰💵💸DE40 / GER40 "Germany40" Index Money Heist is currently experiencing a bullishness,., driven by several key factors. .☝☝☝
⚠️Trading Alert : News Releases and Position Management 📰🗞️🚫🚏
As a reminder, news releases can have a significant impact on market prices and volatility. To minimize potential losses and protect your running positions,
we recommend the following:
Avoid taking new trades during news releases
Use trailing stop-loss orders to protect your running positions and lock in profits
💖Supporting our robbery plan 💥Hit the Boost Button💥 will enable us to effortlessly make and steal money 💰💵. Boost the strength of our robbery team. Every day in this market make money with ease by using the Thief Trading Style.🏆💪🤝❤️🎉🚀
I'll see you soon with another heist plan, so stay tuned 🤑🐱👤🤗🤩

DAX Long From Support! Buy!
Hello,Traders!
DAX is trading in an
Uptrend and the index
Is retesting the horizontal
Support level at 23,319
So we are bullish biased
And we will be expecting
A bullish rebound and
A move up next week
Buy!
Comment and subscribe to help us grow!
Check out other forecasts below too!
Disclosure: I am part of Trade Nation's Influencer program and receive a monthly fee for using their TradingView charts in my analysis.


DE40 – Buy on Dip Within Bullish Trend StructureTrade Setup
Type: Buy Limit
Entry: 23,850
Target: 24,550
Stop Loss: 23,500
Risk/Reward Ratio: ~2:1
Duration: Intraday
Expires: 23/05/2025 21:00
Technical Overview
The broader trend in DE40 remains bullish, with no clear technical signals suggesting the uptrend is ending.
A short-term correction is likely, and there is ample room for a pullback that does not invalidate the overall uptrend.
Buying at 23,850 offers a strong risk/reward entry near key support, avoiding the poor setup of chasing the market at current highs.
A confirmed move through 24,250 would strengthen bullish conviction, aligning with a measured move target of 24,600.
Disclosure: I am part of Trade Nation's Influencer program and receive a monthly fee for using their TradingView charts in my analysis.

USTECH & DE40 Daily Trade SetupsIn this update we review the recent price action in the Nasdaq & the German DAX and identify the next high-probability trading opportunities and price objectives to target. To review today's video analysis, click here!

DAX GE40 on the Move! Bullish Trend Breakdown + Trade PlanI'm currently watching the GER40 / DAX 🇩🇪📈 and can see it’s been in a strong bullish trend on the weekly timeframe 🕒🔥. Price is pushing into new highs 🚀, and I’m eyeing a potential buy opportunity based on this bullish momentum 💪.
However, since we don’t have previous structure levels to work from 📉⛔, we're using the Fibonacci extension tool 🔢📐 — focusing on two key levels for potential take profit targets 🎯💰.
In the video, we break all of this down — including the trend, price action, market structure, and the full trade idea 🧠📊: entry 🎯, stop loss 🛑, and targets 🎯✅.
⚠️ Not financial advice.

GERMAN 40 INDEX PIVOT AREAAfter the strong Performance of German stocks , the index is currently at a Pivot area between 24075 and 24228 , bearish corrections are expected towards 23628 and 23182.
However a break above the area could bring furthur bullish momentum towards 24676 and 25122.

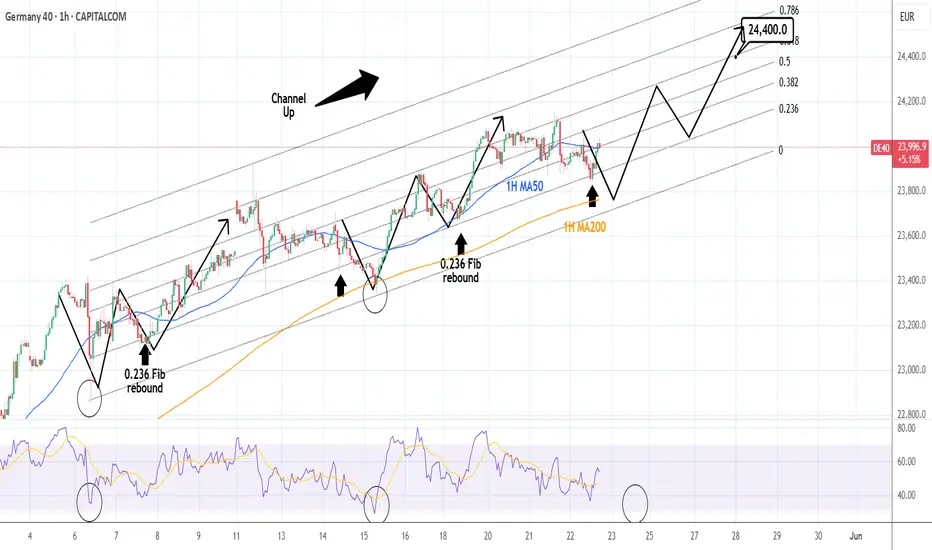
DAX: 1H MA200 supporting the Channel Up. Target 24,400.DAX is on strong bullish levels on its 1D technical outlook (RSI = 67.780, MACD = 423.600, ADX = 73.133) maintaining a short term Channel Up. The last HL bottom was priced on the 1H MA200 on an oversold 1H RSI. Buy and target the 0.618 Fibonacci (TP = 24,400).
See how our prior idea has worked out:
## If you like our free content follow our profile to get more daily ideas. ##
## Comments and likes are greatly appreciated. ##
Dax INTRADAY bullish breakout supported at 23520The DAX index remains in a long-term uptrend, reflecting a bullish overall sentiment. The recent price action shows a bullish breakout above sideways consolidation.
The key support level is at 23,520, which marks the lower boundary of the recent trading range. If the index pulls back and holds above this level, it would suggest continued bullish momentum. A rebound from 23,520 could see the DAX pushing toward resistance levels at 23,990, then 24,200, and potentially 24,450 in the longer term.
On the downside, a confirmed break and daily close below 23,520 would weaken the bullish case. This would open the door for further declines, with the next support at 23,300, followed by a deeper retracement toward 23,060.
Conclusion:
The DAX outlook remains bullish while holding above 23,520. A bounce from this level supports a move higher, but a break below it would shift the outlook to bearish in the short term.
This communication is for informational purposes only and should not be viewed as any form of recommendation as to a particular course of action or as investment advice. It is not intended as an offer or solicitation for the purchase or sale of any financial instrument or as an official confirmation of any transaction. Opinions, estimates and assumptions expressed herein are made as of the date of this communication and are subject to change without notice. This communication has been prepared based upon information, including market prices, data and other information, believed to be reliable; however, Trade Nation does not warrant its completeness or accuracy. All market prices and market data contained in or attached to this communication are indicative and subject to change without notice.

DAX 19.05.2025~+ post US-China trade talks positive sentiment
~+ Latest US ec. data (Claims, Philly Fed, Retail, PPI down)
*Reentry

#DAX30 Surges to 24,000: What’s Behind the Record-Breaking RallyOn May 20, 2025, Germany’s benchmark stock index, the #DAX30, crossed the 24,000-point threshold for the first time in its history, reaching an all-time high of 24,079.40. This historic milestone reflects growing investor confidence in the prospects of Europe’s largest economy.
The surge of the #DAX30 beyond the 24,000 mark was driven by a combination of key factors:
Improved geopolitical climate : Global tensions have eased — most notably between the United States and China. Signs of de-escalation in trade policy between the world’s largest economies have bolstered investor confidence. Additionally, an improved negotiation climate in Eastern Europe, particularly due to reduced conflict in Ukraine, has helped lower market uncertainty.
Strong corporate earnings : Major German corporations within the #DAX30 have posted robust quarterly results. Leading the charge were technology giants (e.g., SAP) and industrial powerhouses (such as Siemens and BMW), which reported increased profits despite a challenging macroeconomic environment. This has reinforced confidence in the resilience of German businesses.
ECB monetary policy expectations : Markets are pricing in a potential easing of the European Central Bank’s monetary policy. Although interest rates remain elevated, growing signals of a possible rate cut in the second half of 2025 are stimulating equity markets and making stock investments more attractive.
Export growth and trade optimism : The reduction of trade barriers, a stronger euro, and a rebound in global trade have positively impacted export-driven German companies. As one of the world’s leading export economies, Germany is benefiting from a renewed global demand recovery.
Hopes for domestic reforms : The German government is actively pushing investments in infrastructure, digital transformation, and the green economy. These initiatives are boosting investor sentiment, particularly in the technology and sustainable energy sectors.
Technical momentum : From a technical perspective, the breakout above the 24,000 level served as a catalyst for speculative capital inflows. Many traders and funds that follow trends and resistance levels initiated buy positions after the breakout, amplifying the upward momentum.
This combination of fundamental and technical drivers has created a powerful growth impulse for the # DAX30 . According to analysts at FreshForex, the index may continue its upward trajectory — provided current macroeconomic stability is maintained.
DAX: Strong Growth Ahead! Long!
My dear friends,
Today we will analyse DAX together☺️
The price is near a wide key level
and the pair is approaching a significant decision level of 24,119.04. Therefore, a strong bearish reaction here could determine the next move down.We will watch for a confirmation candle, and then target the next key level of 24,214.64.Recommend Stop-loss is beyond the current level.
❤️Sending you lots of Love and Hugs❤️

DAX H4 | Falling toward an overlap supportThe DAX (GER30) is falling towards an overlap support and could potentially bounce off this level to climb higher.
Buy entry is at 23,447.57 which is an overlap support.
Stop loss is at 22,700.00 which is a level that lies underneath an overlap support and the 23.6% Fibonacci retracement.
Take profit is at 24,732.86 which is a resistance that aligns with the 127.2% Fibonacci extension.
High Risk Investment Warning
Trading Forex/CFDs on margin carries a high level of risk and may not be suitable for all investors. Leverage can work against you.
Stratos Markets Limited (tradu.com/uk):
CFDs are complex instruments and come with a high risk of losing money rapidly due to leverage. 63% of retail investor accounts lose money when trading CFDs with this provider. You should consider whether you understand how CFDs work and whether you can afford to take the high risk of losing your money.
Stratos Europe Ltd (tradu.com/eu):
CFDs are complex instruments and come with a high risk of losing money rapidly due to leverage. 63% of retail investor accounts lose money when trading CFDs with this provider. You should consider whether you understand how CFDs work and whether you can afford to take the high risk of losing your money.
Stratos Global LLC (tradu.com/en):
Losses can exceed deposits.
Please be advised that the information presented on TradingView is provided to Tradu (‘Company’, ‘we’) by a third-party provider (‘TFA Global Pte Ltd’). Please be reminded that you are solely responsible for the trading decisions on your account. There is a very high degree of risk involved in trading. Any information and/or content is intended entirely for research, educational and informational purposes only and does not constitute investment or consultation advice or investment strategy. The information is not tailored to the investment needs of any specific person and therefore does not involve a consideration of any of the investment objectives, financial situation or needs of any viewer that may receive it. Kindly also note that past performance is not a reliable indicator of future results. Actual results may differ materially from those anticipated in forward-looking or past performance statements. We assume no liability as to the accuracy or completeness of any of the information and/or content provided herein and the Company cannot be held responsible for any omission, mistake nor for any loss or damage including without limitation to any loss of profit which may arise from reliance on any information supplied by TFA Global Pte Ltd.
The speaker(s) is neither an employee, agent nor representative of Tradu and is therefore acting independently. The opinions given are their own, constitute general market commentary, and do not constitute the opinion or advice of Tradu or any form of personal or investment advice. Tradu neither endorses nor guarantees offerings of third-party speakers, nor is Tradu responsible for the content, veracity or opinions of third-party speakers, presenters or participants.

DAX/GER - setting up a perfect SHORTTeam, please carefully review the chart.
We have a soft short position at this market price of 24037-24056
However, I would love to ADD extra volume at 23135-23155
Our first target at 23950-23925
NOTE: once it reaches the target - take 30-50% volume partial and bring stop loss to BE
Our second target is 23865-23825
Please follow the instructions carefully.
DAX INTRADAY sideways consolidation brekoutThe DAX index remains in a long-term uptrend, reflecting a bullish overall sentiment. The recent price action shows a bullish breakout above sideways consolidation.
The key support level is at 23,520, which marks the lower boundary of the recent trading range. If the index pulls back and holds above this level, it would suggest continued bullish momentum. A rebound from 23,520 could see the DAX pushing toward resistance levels at 23,990, then 24,200, and potentially 24,450 in the longer term.
On the downside, a confirmed break and daily close below 23,520 would weaken the bullish case. This would open the door for further declines, with the next support at 23,300, followed by a deeper retracement toward 23,060.
Conclusion:
The DAX outlook remains bullish while holding above 23,520. A bounce from this level supports a move higher, but a break below it would shift the outlook to bearish in the short term.
This communication is for informational purposes only and should not be viewed as any form of recommendation as to a particular course of action or as investment advice. It is not intended as an offer or solicitation for the purchase or sale of any financial instrument or as an official confirmation of any transaction. Opinions, estimates and assumptions expressed herein are made as of the date of this communication and are subject to change without notice. This communication has been prepared based upon information, including market prices, data and other information, believed to be reliable; however, Trade Nation does not warrant its completeness or accuracy. All market prices and market data contained in or attached to this communication are indicative and subject to change without notice.

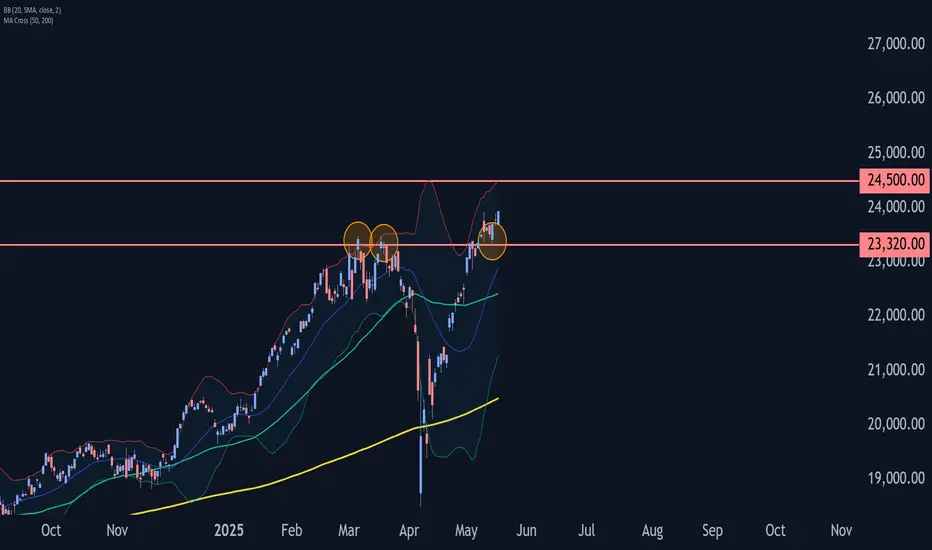
DAX Wave Analysis – 19 May 2025
- DAX reversed from the support level 23320.00
- Likely to rise to resistance level 24500.00
DAX index recently reversed from the key support level 23320.00 (former double top from March, as can be seen from the daily DAX chart below).
The upward reversal from the support level 23320.00 started the active minor impulse wave 5, which then broke above the minor resistance level 23925.00 (which stopped the previous impulse wave 3).
Given a clear daily uptrend, the DAX index can be expected to rise to the next resistance level 24500.00 (which is the target price for the completion of the active impulse wave (3)).
The Burst of the DAX Bubble: What's Next?In the previous scenario, the price bubble of Germany's DAX stock index burst, leading to a sharp drop in the index.
Now, we're anticipating that the second bubble might burst as well.

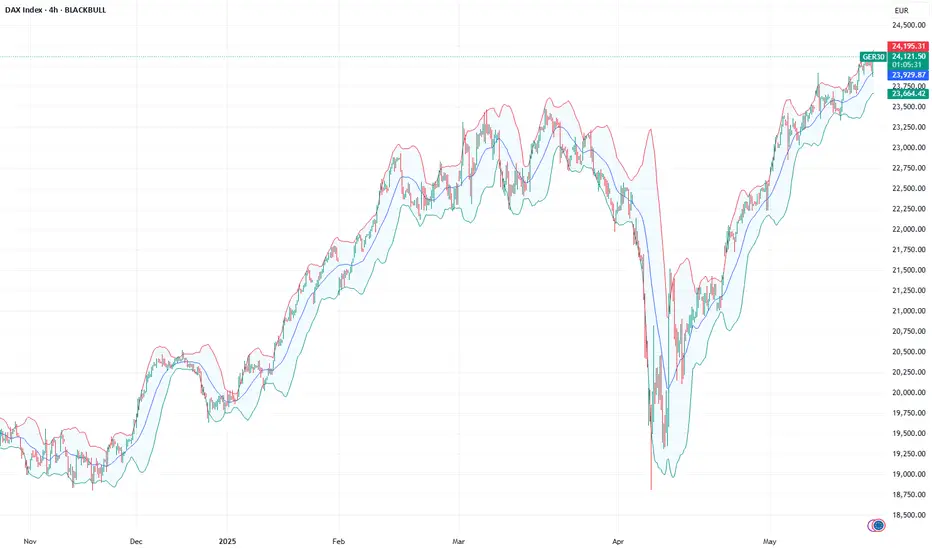
DAX is holing the rallyA bullish situation is continuing to build on DAX (German index). Unlike US indices, it has renewed the historical high and displays notable strength, as the US dollar pushes down. “Sell America” narrative helps it to consistently climb higher without any pullbacks, forming small consolidations all the way during the rally.
The previous “coil” (a very narrow chart formation) has been lasting for already two weeks, so it’s possible to either observe a correction to the downside or an upside breakout. The latter seems as a more realistic scenario given the improving sentiment for stocks across the board.
Three days of correction below the previous intermediate-term high can point to good timing for a possible long position, and a position below upper band of Bollinger Bands (21) shows yet a potential to continue rising.
Don't forget - this is just the idea, always do your own research and never forget to manage your risk!
