FTSE100 corrective pullback supported at 8550Trend Overview:
The FTSE 100 remains in a prevailing uptrend, with recent price action reflecting a corrective pullback towards a previous consolidation zone, now acting as a support level.
Key Levels:
Support: 8550 (key level), 8490, 8430
Resistance: 8614, 8655, 8700
Bullish Scenario:
A pullback to 8550, followed by a strong bullish reversal, could confirm the support level and signal further upside momentum. A breakout above 8614 may open the way toward 8655 and 8700 in the longer term.
Bearish Scenario:
A daily close below 8550 would weaken the bullish outlook, increasing the likelihood of a retracement towards 8490, with 8430 as the next downside target.
Conclusion:
The FTSE 100 remains bullish above 8550, with potential upside targets at 8614, 8655, and 8700. However, a break below 8550 could shift momentum to the downside, targeting 8490 and 8430. Traders should watch price action near 8550 for confirmation of the next directional move.
This communication is for informational purposes only and should not be viewed as any form of recommendation as to a particular course of action or as investment advice. It is not intended as an offer or solicitation for the purchase or sale of any financial instrument or as an official confirmation of any transaction. Opinions, estimates and assumptions expressed herein are made as of the date of this communication and are subject to change without notice. This communication has been prepared based upon information, including market prices, data and other information, believed to be reliable; however, Trade Nation does not warrant its completeness or accuracy. All market prices and market data contained in or attached to this communication are indicative and subject to change without notice.
UK100 trade ideas

FTSE100 INTRADAY sideways consolidation supported at 8594The FTSE 100 equity index is exhibiting bullish sentiment, reinforced by the prevailing uptrend. The recent intraday price action appears to be a corrective sideways consolidation, potentially forming a Bullish Flag continuation pattern, which typically precedes a continuation of the upward momentum.
Key Trading Levels:
Support Level: The critical support level to watch is 8,594, marking the previous consolidation price range.
Upside Targets: A corrective pullback from current levels, followed by a bullish bounce from the 8,594 level, could pave the way for an upward move toward the next resistance levels at 8,729, followed by 8,798 and 8,853 over a longer timeframe.
Alternative Bearish Scenario:
A confirmed loss of support at 8,594, with a daily close below this level, would invalidate the bullish outlook. In such a case, the index could experience further retracement, with potential downside targets at 8,539 and 8,465.
Conclusion:
While the current sentiment remains bullish, traders should closely monitor the 8,594 support level. A successful bounce could reaffirm the bullish momentum, targeting higher resistance levels. Conversely, a break and close below this support would signal a shift in sentiment, suggesting a deeper corrective move.
This communication is for informational purposes only and should not be viewed as any form of recommendation as to a particular course of action or as investment advice. It is not intended as an offer or solicitation for the purchase or sale of any financial instrument or as an official confirmation of any transaction. Opinions, estimates and assumptions expressed herein are made as of the date of this communication and are subject to change without notice. This communication has been prepared based upon information, including market prices, data and other information, believed to be reliable; however, Trade Nation does not warrant its completeness or accuracy. All market prices and market data contained in or attached to this communication are indicative and subject to change without notice.

FTSE 100: Can April's Seasonal Surge Overcome Fiscal Tightening?🌸 April: A Historically Bullish Month for the FTSE 100 📈
Over the past 25 years, April has consistently been the strongest month for the FTSE 100, delivering an average return of 2.28% and boasting a 76% win rate. 🌟 This seasonal strength is driven by several key factors:
📊 Earnings Season Momentum: April is a pivotal month for corporate earnings, with many FTSE 100 companies benefiting from a post-first-quarter earnings boost. 💼
💷 Fiscal Year-End Flows: UK-based funds often adjust their portfolios at the end of the tax year in early April, leading to a reallocation into equities. 🔄
💸 Dividend Reinvestment: As a high-dividend-yielding index, the FTSE 100 typically experiences dividend reinvestment flows in April, further supporting stock prices. 📈
Despite the challenging macroeconomic environment, these seasonal drivers suggest that the FTSE 100 could maintain its historical trend of strong April performance. Notably, even in years with intra-period declines of up to 6.88%, the index has managed to deliver positive returns during this period. 💪
🇬🇧 UK Fiscal Policy and Market Implications 💡
This year, the bullish seasonal trend for the FTSE 100 coincides with significant fiscal developments. On March 26, UK Chancellor Rachel Reeves delivered the Spring Statement, outlining measures to stabilize public finances amidst mounting economic pressures. 📜 According to the Office for Budget Responsibility (OBR), the UK is at risk of missing key fiscal targets, prompting the government to model spending cuts of up to 11%. Welfare programs and green investments 🌱 are expected to bear the brunt of these reductions.
Additionally, the Bank of England's stance on inflation remains a critical factor. 📉 Persistent inflation risks could lead to a more hawkish monetary policy, potentially weighing on rate-sensitive sectors within the FTSE 100. However, the index's strong seasonal pattern, driven by earnings momentum, fiscal year-end flows, and dividend reinvestments, provides a counterbalance to these headwinds. ⚖️
🔮 Outlook for April 2025 🌟
As of late March 2025, the FTSE 100 has shown resilience, with sectors such as energy ⚡ and homebuilders 🏠 leading gains ahead of the Spring Statement. While fiscal tightening and inflationary pressures present challenges, the historical strength of April, combined with supportive seasonal factors, suggests that the FTSE 100 could still deliver positive returns this month. 📅 Investors will closely monitor the impact of fiscal policy adjustments and the Bank of England's monetary stance as they navigate this critical period. 🧐
Not Financial Advice.

UK100 Technical Analysis 🔹 Trend Overview:
UK100 is currently consolidating between key support and resistance levels, suggesting a potential breakout scenario.
🔹 Key Levels:
📈 Resistance: 8,727 – A breakout above this level could push price toward 8,818.
📉 Support: 8,627 – If broken, price may drop toward 8,475.
🔹 Market Structure:
✅ Price is in a range-bound phase, with a possible breakout in either direction.
🚀 Bullish scenario: Break above 8,727 → Retest → Target 8,818 → 8,912.
⚠️ Bearish scenario: Rejection at 8,727 → Drop to 8,627 → Break → Target 8,475.
🔹 Trade Idea:
Bullish above 8,727 with targets at 8,818 and 8,912.
Bearish below 8,627 with targets at 8,475.
📌 Risk Management: Wait for confirmation of breakout or rejection before entering trades.

FTSE INTRADAY bullish ahead of UK Spring StatementThe FTSE 100 equity index is exhibiting bullish sentiment, reinforced by the prevailing uptrend. The recent intraday price action appears to be a corrective sideways consolidation, potentially forming a Bullish Flag continuation pattern, which typically precedes a continuation of the upward momentum.
Key Trading Levels:
Support Level: The critical support level to watch is 8,594, marking the previous consolidation price range.
Upside Targets: A corrective pullback from current levels, followed by a bullish bounce from the 8,596 level, could pave the way for an upward move toward the next resistance levels at 8,729, followed by 8,798 and 8,853 over a longer timeframe.
Alternative Bearish Scenario:
A confirmed loss of support at 8,594, with a daily close below this level, would invalidate the bullish outlook. In such a case, the index could experience further retracement, with potential downside targets at 8,539 and 8,465.
Conclusion:
While the current sentiment remains bullish, traders should closely monitor the 8,594 support level. A successful bounce could reaffirm the bullish momentum, targeting higher resistance levels. Conversely, a break and close below this support would signal a shift in sentiment, suggesting a deeper corrective move.
This communication is for informational purposes only and should not be viewed as any form of recommendation as to a particular course of action or as investment advice. It is not intended as an offer or solicitation for the purchase or sale of any financial instrument or as an official confirmation of any transaction. Opinions, estimates and assumptions expressed herein are made as of the date of this communication and are subject to change without notice. This communication has been prepared based upon information, including market prices, data and other information, believed to be reliable; however, Trade Nation does not warrant its completeness or accuracy. All market prices and market data contained in or attached to this communication are indicative and subject to change without notice.

UK Inflation DeclinesUK Inflation Declines
Today, the latest UK Consumer Price Index (CPI) figures were released. According to ForexFactory:
The actual annual CPI came in at 2.8%,
Analysts had expected it to remain at the previous level of 3.0%.
As a result, the British pound weakened, and a slight spike in volatility was observed on the FTSE 100 stock index chart (UK 100 on FXOpen)
Technical Analysis of FTSE 100
In early March, bearish activity (indicated by an arrow) led to a break of the support level around 8757, which then acted as resistance.
However, as soon as bears pushed the price below the February low, bulls stepped in.
Currently, the UK stock index chart is forming a narrowing triangle, which can be interpreted as a sign of equilibrium between supply and demand. However, this pattern will eventually be broken.
It is possible that the release of significant news—such as developments in international trade tariffs—could disrupt the balance of supply and demand, triggering a trend movement for the FTSE 100 index (UK 100 on FXOpen).
This article represents the opinion of the Companies operating under the FXOpen brand only. It is not to be construed as an offer, solicitation, or recommendation with respect to products and services provided by the Companies operating under the FXOpen brand, nor is it to be considered financial advice.

WHY UK100 might drop for sometimeAs we can see on the MAJOR KEY LEVEL where price formed multiple rejections and reversed, this is a confirmation of selling pressure also price broke out of our Previous support and retested it that gave us a New resistance which shows us that bears/sellers have potential to push it down and we already have multiple confirmations of that along with our Downtrend trendline being respected. If price shows a rejection candlestick on the trend line then that is our confirmation price will go down
what are your views guys?

FTSE100 INTRADAY Bullish Flag continuation pattern supported at The FTSE 100 equity index is exhibiting bullish sentiment, reinforced by the prevailing uptrend. The recent intraday price action appears to be a corrective sideways consolidation, potentially forming a Bullish Flag continuation pattern, which typically precedes a continuation of the upward momentum.
Key Trading Levels:
Support Level: The critical support level to watch is 8,594, marking the previous consolidation price range.
Upside Targets: A corrective pullback from current levels, followed by a bullish bounce from the 8,596 level, could pave the way for an upward move toward the next resistance levels at 8,729, followed by 8,798 and 8,853 over a longer timeframe.
Alternative Bearish Scenario:
A confirmed loss of support at 8,594, with a daily close below this level, would invalidate the bullish outlook. In such a case, the index could experience further retracement, with potential downside targets at 8,539 and 8,465.
Conclusion:
While the current sentiment remains bullish, traders should closely monitor the 8,594 support level. A successful bounce could reaffirm the bullish momentum, targeting higher resistance levels. Conversely, a break and close below this support would signal a shift in sentiment, suggesting a deeper corrective move.
This communication is for informational purposes only and should not be viewed as any form of recommendation as to a particular course of action or as investment advice. It is not intended as an offer or solicitation for the purchase or sale of any financial instrument or as an official confirmation of any transaction. Opinions, estimates and assumptions expressed herein are made as of the date of this communication and are subject to change without notice. This communication has been prepared based upon information, including market prices, data and other information, believed to be reliable; however, Trade Nation does not warrant its completeness or accuracy. All market prices and market data contained in or attached to this communication are indicative and subject to change without notice.

FTSE100 The Week Ahead 24th March '25FTSE100 bullish & overbought, the key trading level is at 8730
This communication is for informational purposes only and should not be viewed as any form of recommendation as to a particular course of action or as investment advice. It is not intended as an offer or solicitation for the purchase or sale of any financial instrument or as an official confirmation of any transaction. Opinions, estimates and assumptions expressed herein are made as of the date of this communication and are subject to change without notice. This communication has been prepared based upon information, including market prices, data and other information, believed to be reliable; however, Trade Nation does not warrant its completeness or accuracy. All market prices and market data contained in or attached to this communication are indicative and subject to change without notice.

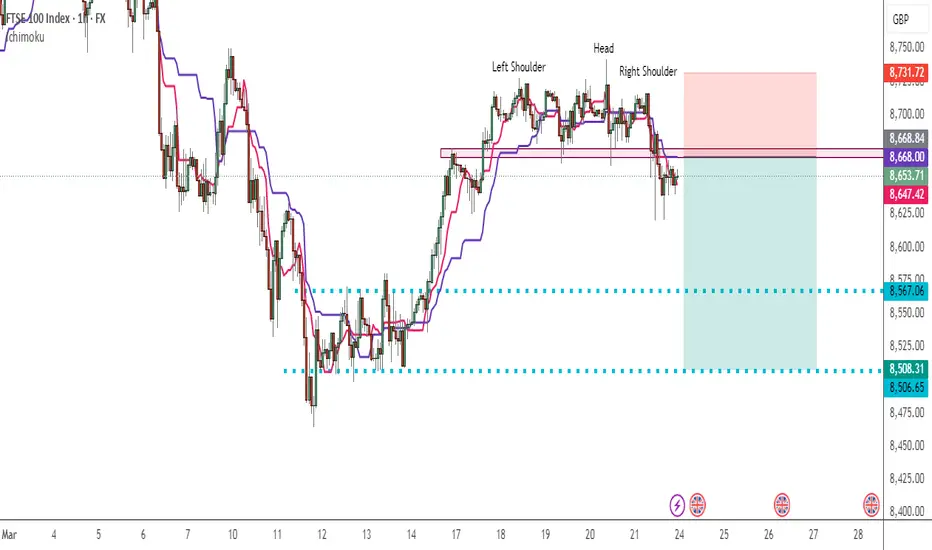
short position on uk100index has already made head and shoulder pattern and broke down neck line
we are waiting for our sell limit to activate upon market opening
RR for this position is 2.5
wait for the result
UK100 - Expecting The Price To Drop Lower FurtherHi Traders, on March 11th I shared this "UK100 - Looking To Sell Pullbacks In The Short Term"
We expected to see correction prior to the bearish continuation. You can read the full post using the link above.
Price is moving as per the plan!!!
Based on the current scenario my bearish view still remains the same here.
We have bearish divergence in play based on the moving averages of the MACD and I expect the price to drop lower further until the strong resistance zone holds
If you enjoy this idea, don’t forget to LIKE 👍, FOLLOW ✅, SHARE 🙌, and COMMENT ✍! Drop your thoughts and charts below to keep the discussion going. Your support helps keep this content free and reach more people! 🚀
---------------------------------------------------------------------------------------------------------------------
Disclosure: I am part of Trade Nation's Influencer program and receive a monthly fee for using their TradingView charts in my analysis.


FTSE INTRADAY awaits BoE MPC The FTSE 100 index could see some volatility today as the Bank of England’s Monetary Policy Committee (MPC) meeting is set for 12:00 London time. The central bank is expected to keep the benchmark rate at 4.50%. Earlier today, UK jobs data showed the ILO Unemployment Rate remained steady at 4.4% for the three months to January.
The FTSE 100 index is currently exhibiting a neutral sentiment, as evidenced by the prevailing sideways consolidation. The primary focus remains on the key resistance level at 8745, which corresponds to the current intraday swing high. Alternatively the downside is supported at 8616. This levels are critical as they determine the next directional move of the index.
Key Support and Resistance Levels
Resistance Level 1: 8745
Resistance Level 2: 8770
Resistance Level 3: 8834 - 8910
Support Level 1: 8616
Support Level 2: 8505
Support Level 3: 8352
This communication is for informational purposes only and should not be viewed as any form of recommendation as to a particular course of action or as investment advice. It is not intended as an offer or solicitation for the purchase or sale of any financial instrument or as an official confirmation of any transaction. Opinions, estimates and assumptions expressed herein are made as of the date of this communication and are subject to change without notice. This communication has been prepared based upon information, including market prices, data and other information, believed to be reliable; however, Trade Nation does not warrant its completeness or accuracy. All market prices and market data contained in or attached to this communication are indicative and subject to change without notice.

UK100 GOING UP?!Good day traders, my analysis shows that the price will head up but we need some few confirmations first before that
The previous trend was a bearish trend and price failed to create new lower lows and we had our Change of Character/Trend. Price broke above our CHoC giving us a New higher high which shows that buyers are more than sellers, causing price to head up
We broke above the New high and now the price is "Retracing" before it continues it's bullish movement, the best thing to do would be to wait for a bullish candlestick on the Zone(new high) before buying

FTSE INTRADAY capped by 8715The FTSE 100 index is currently exhibiting a neutral sentiment, as evidenced by the prevailing sideways consolidation. The primary focus remains on the key resistance level at 8715, which corresponds to the current intraday swing high. This level is critical as it determines the next directional move of the index.
From the current levels, an oversold rally could potentially emerge, leading to a retest of the 8715 resistance. A bearish rejection from this level would reinforce the downtrend, paving the way for a move towards the 8500 support. Further downside momentum could extend losses to the next support levels at 8440 and 8352 over a longer timeframe.
On the other hand, a confirmed breakout above 8715 on a daily closing basis would invalidate the bearish outlook. In such a scenario, the index is likely to experience renewed buying interest, targeting the next resistance at 8770, followed by a potential rally towards the 8834 and 8910 level.
Conclusion:
The overall sentiment for the FTSE 100 remains bearish unless a decisive breakout above the 8715 resistance occurs. Traders should monitor price action around this critical level for confirmation of either a continuation of the downtrend or a potential bullish reversal.
This communication is for informational purposes only and should not be viewed as any form of recommendation as to a particular course of action or as investment advice. It is not intended as an offer or solicitation for the purchase or sale of any financial instrument or as an official confirmation of any transaction. Opinions, estimates and assumptions expressed herein are made as of the date of this communication and are subject to change without notice. This communication has been prepared based upon information, including market prices, data and other information, believed to be reliable; however, Trade Nation does not warrant its completeness or accuracy. All market prices and market data contained in or attached to this communication are indicative and subject to change without notice.

UK100 Buy ZoneSee how price reacts in this zones, I'm looking for entries like those marked on the chart.

UK100 - Trade IdeaHi all,
Here we have a strong Counter Trend setup, in my own opinion it looks to be very strong with no resting Liquidity sitting higher telling me price will want to chase for that sell side Imbalance.
It is a counter trend setup so its a high risk to high reward but could be worth the trade.
Ill be keeping my eyes on this for the close future to see how Price Action develops.
Good luck if you decide to follow this trade idea
Cheers

FTSE 100 Wave Analysis – 17 March 2025
- FTSE 100 reversed from key support level 8425.00
- Likely to rise to resistance level 8832.00
FTSE 100 index recently reversed up from the key support level 8425.00, a former strong resistance from last year, which has stopped multiple upward impulses from May to December as can be seen from the daily FTSE 100 chart below.
The support level 8425.00 was strengthened by the lower daily Bollinger Band and by the 50% Fibonacci correction of the sharp upward impulse from December.
Given the clear daily uptrend, FTSE 100 index can be expected to rise to the next resistance level 8832.00 (which reversed the previous waves 3 and b).

FTSE INTRADAY Bullish breakoutThe FTSE 100 index is currently exhibiting a neutral sentiment, as evidenced by the prevailing sideways consolidation. The primary focus remains on the key resistance level at 8700, which corresponds to the current intraday swing high. This level is critical as it determines the next directional move of the index.
From the current levels, an oversold rally could potentially emerge, leading to a retest of the 8700 resistance. A bearish rejection from this level would reinforce the downtrend, paving the way for a move towards the 8500 support. Further downside momentum could extend losses to the next support levels at 8440 and 8352 over a longer timeframe.
On the other hand, a confirmed breakout above 8700 on a daily closing basis would invalidate the bearish outlook. In such a scenario, the index is likely to experience renewed buying interest, targeting the next resistance at 8770, followed by a potential rally towards the 8834 level.
Conclusion:
The overall sentiment for the FTSE 100 remains bearish unless a decisive breakout above the 8700 resistance occurs. Traders should monitor price action around this critical level for confirmation of either a continuation of the downtrend or a potential bullish reversal.
This communication is for informational purposes only and should not be viewed as any form of recommendation as to a particular course of action or as investment advice. It is not intended as an offer or solicitation for the purchase or sale of any financial instrument or as an official confirmation of any transaction. Opinions, estimates and assumptions expressed herein are made as of the date of this communication and are subject to change without notice. This communication has been prepared based upon information, including market prices, data and other information, believed to be reliable; however, Trade Nation does not warrant its completeness or accuracy. All market prices and market data contained in or attached to this communication are indicative and subject to change without notice.

Bullish bounce?UK100 has bounced off the pivot and could rise to the 1st resistance.
Pivot; 8,460.55
1st Support: 8,314.59
1st Resistance; 8,913.87
Risk Warning:
Trading Forex and CFDs carries a high level of risk to your capital and you should only trade with money you can afford to lose. Trading Forex and CFDs may not be suitable for all investors, so please ensure that you fully understand the risks involved and seek independent advice if necessary.
Disclaimer:
The above opinions given constitute general market commentary, and do not constitute the opinion or advice of IC Markets or any form of personal or investment advice.
Any opinions, news, research, analyses, prices, other information, or links to third-party sites contained on this website are provided on an "as-is" basis, are intended only to be informative, is not an advice nor a recommendation, nor research, or a record of our trading prices, or an offer of, or solicitation for a transaction in any financial instrument and thus should not be treated as such. The information provided does not involve any specific investment objectives, financial situation and needs of any specific person who may receive it. Please be aware, that past performance is not a reliable indicator of future performance and/or results. Past Performance or Forward-looking scenarios based upon the reasonable beliefs of the third-party provider are not a guarantee of future performance. Actual results may differ materially from those anticipated in forward-looking or past performance statements. IC Markets makes no representation or warranty and assumes no liability as to the accuracy or completeness of the information provided, nor any loss arising from any investment based on a recommendation, forecast or any information supplied by any third-party.

FTSE100 The Week Ahead 17th March '25FTSE100 INTRADAY bullish & oversold, the key trading level is at 8520
This communication is for informational purposes only and should not be viewed as any form of recommendation as to a particular course of action or as investment advice. It is not intended as an offer or solicitation for the purchase or sale of any financial instrument or as an official confirmation of any transaction. Opinions, estimates and assumptions expressed herein are made as of the date of this communication and are subject to change without notice. This communication has been prepared based upon information, including market prices, data and other information, believed to be reliable; however, Trade Nation does not warrant its completeness or accuracy. All market prices and market data contained in or attached to this communication are indicative and subject to change without notice.

"UK100 / FTSE100" Indices Market Bullish Heist Plan🌟Hi! Hola! Ola! Bonjour! Hallo!🌟
Dear Money Makers & Thieves, 🤑 💰🐱👤🐱🏍
Based on 🔥Thief Trading style technical and fundamental analysis🔥, here is our master plan to heist the "UK100 / FTSE100" Indices Market. Please adhere to the strategy I've outlined in the chart, which emphasizes long entry. Our aim is the high-risk Red Zone. Risky level, overbought market, consolidation, trend reversal, trap at the level where traders and bearish robbers are stronger. 🏆💸Book Profits, Be wealthy and safe trade.💪🏆🎉
Entry 📈 : "The heist is on! Wait for the MA breakout (8850.00) then make your move - Bullish profits await!"
however I advise to placing the Buy Stop Orders above the breakout MA or placing the Buy limit orders within a 15 or 30 minute timeframe. Entry from the most recent or closest low or high level should be in retest.
Stop Loss 🛑: Thief SL placed at 8720.00 (swing Trade Basis) Using the 4H period, the recent / Swing Low or High level.
SL is based on your risk of the trade, lot size and how many multiple orders you have to take.
Target 🎯: 9150.00 (or) Escape Before the Target
🧲Scalpers, take note 👀 : only scalp on the Long side. If you have a lot of money, you can go straight away; if not, you can join swing traders and carry out the robbery plan. Use trailing SL to safeguard your money 💰.
📰🗞️Fundamental, Macro, COT, Sentimental Outlook:
"UK100 / FTSE100" Indices Market is currently experiencing a bullish trend,., driven by several key factors.
🟤Market Overview
Current Price: 8740.00
30-Day High: 8920.00
30-Day Low: 8450.00
30-Day Average: 8630.00
🔵Fundamental Analysis
Economic Trends: The UK economy is expected to grow, driven by a rebound in consumer spending and investment
Interest Rates: The Bank of England is expected to maintain low interest rates, supporting the UK stock market
🟢Macro Economics
Global Economic Trends: The ongoing global economic recovery is expected to drive up demand for UK exports
Inflation Rate: Global inflation is expected to rise to 3.8% in 2025, potentially increasing demand for UK goods and services
Interest Rates: Central banks are expected to maintain low interest rates in 2025, supporting stock markets
🟡COT Data
Non-Commercial Traders (Institutional):
Net Long Positions: 52%
Open Interest: 120,000 contracts
Commercial Traders (Companies):
Net Short Positions: 28%
Open Interest: 80,000 contracts
Non-Reportable Traders (Small Traders):
Net Long Positions: 20%
Open Interest: 40,000 contracts
COT Ratio: 1.9 (indicating a bullish trend)
🟠Sentimental Analysis
Institutional Sentiment: 58% bullish, 42% bearish
Retail Sentiment: 55% bullish, 45% bearish
Market Mood: The overall market mood is bullish, with a sentiment score of +25
🔴Positioning Analysis
Institutional Traders: Net long positions increased by 8% over the past week, indicating growing bullish sentiment
Retail Traders: Net long positions decreased by 3% over the past week, indicating decreasing bullish sentiment
Leverage: The average leverage used by traders has increased to 2.8, indicating growing confidence in the market
⚫Overall Outlook
The overall outlook for UK100 is bullish, driven by a combination of fundamental, technical, and sentimental factors. The expected growth in the UK economy, low interest rates, and bullish market sentiment are all supporting the bullish trend. However, investors should remain cautious of potential downside risks, including changes in global economic trends and unexpected regulatory developments.
⚠️Trading Alert : News Releases and Position Management 📰 🗞️ 🚫🚏
As a reminder, news releases can have a significant impact on market prices and volatility. To minimize potential losses and protect your running positions,
we recommend the following:
Avoid taking new trades during news releases
Use trailing stop-loss orders to protect your running positions and lock in profits
📌Please note that this is a general analysis and not personalized investment advice. It's essential to consider your own risk tolerance and market analysis before making any investment decisions.
📌Keep in mind that these factors can change rapidly, and it's essential to stay up-to-date with market developments and adjust your analysis accordingly.
💖Supporting our robbery plan will enable us to effortlessly make and steal money 💰💵 Tell your friends, Colleagues and family to follow, like, and share. Boost the strength of our robbery team. Every day in this market make money with ease by using the Thief Trading Style.🏆💪🤝❤️🎉🚀
I'll see you soon with another heist plan, so stay tuned 🤑🐱👤🤗🤩

T/R zonesThis idea is based on transient/recurrent zones
Very high probability (90%+) for the price to hit TP.
Probability was calculated on TF 15min.
