Weekly Price Action: Dow Jones DJI Tuesday 4/29/2025In this video, we will be looking into the potential price action DJI.
WS30M trade ideas

US30 LOCAL SHORT|
✅DOW JONES is going up now
But a strong resistance level is ahead at 40,947
Thus I am expecting a pullback
And a move down towards the target of 40,314
SHORT🔥
✅Like and subscribe to never miss a new idea!✅
Disclosure: I am part of Trade Nation's Influencer program and receive a monthly fee for using their TradingView charts in my analysis.

DJIA Tests Major Resistance – Reversal or Breakout Next?The Dow Jones Industrial Average is pressing against a key resistance zone near 40,860, the neckline of a double-bottom pattern after rebounding sharply from its mid-April low:
📈 Strong 2-week rally from sub-37K lows
🔵 Price attempting to break the neckline after reclaiming the 50-day SMA
📊 RSI near neutral at 51 – plenty of room to run
📉 MACD accelerating upward, hinting at bullish momentum
If price clears and holds above 40,860, bulls could target a move back toward 42,500–43,000. Failure to break this zone may trigger a pullback toward the 50-day SMA near 41,500.
The setup is constructive — but the bulls need confirmation.
-MW

US30 Trade Update – Target HitFollowing my earlier post, I waited patiently for a solid confirmation. After price closed above the New York ORB, I entered long — and after a long wait, the trade finally hit the target right at the higher zone I had marked in advance.
This was a good reminder of the value of patience, planning, and trusting the process. The setup played out just as anticipated, and the breakout above structure delivered beautifully.
✅ Trade plan respected
📈 Entry after NY ORB breakout
🎯 Target reached with solid momentum
📌 Reminder: This is my personal analysis and part of my ongoing learning journey. Please do your own research and always manage risk responsibly.

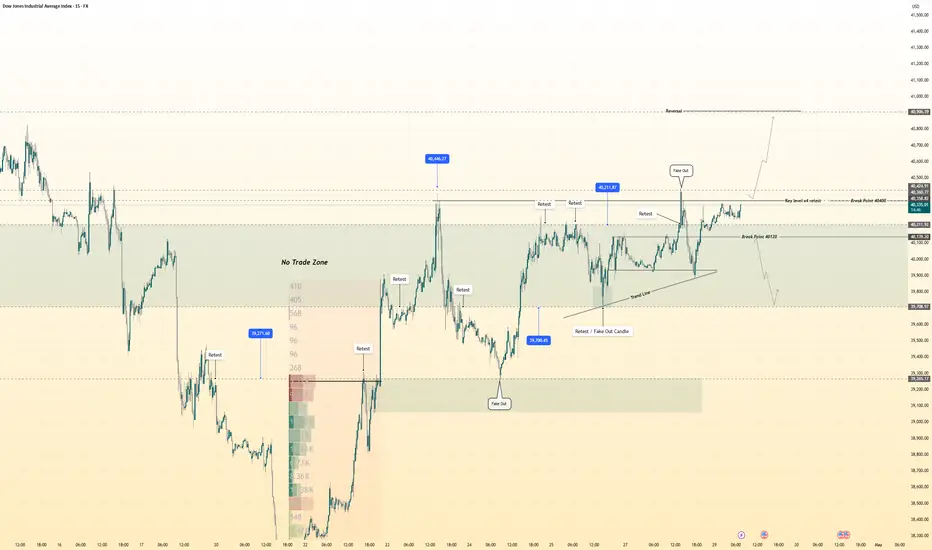
Hanzo | US30 15 min Breaks – Will Confirm the Next Move🆚 US30 – Hanzo’s Strike Setup
🔥 Timeframe: 15-Minute (15M)
——————
💯 Main Focus: Bullish Breakout at 40360
We are watching this zone closely.
💯 Main Focus: Bearish Breakout at 40130
We are watching this zone closely.
📌 If price breaks with high volume, it confirms Smart Money is in control, and a strong move may follow.
———
Analysis
👌 Market Signs (15M TF):
• Liquidity Grab + CHoCH at 40420
• Liquidity Grab + CHoCH at 39870
• Strong Rejections seen at:
➗ 39900 – Major support / Key level
➗ 40300 : 40400 – Proven resistance
🩸 Key Zones to Watch:
• 40200 – 🔥 Bullish breakout level X 3 Swing Retest
• 40550 – Strong resistance (tested 5 times)
• 40200 – Equal lows
• 40420 – Equal highs
Hanzo | US30 15 min Breaks – Will Confirm the Next Move
BUY US30 nowWe’re seeing a potential breakout and retest setup forming on the US30, with clear market structure and volume confirmation.
🔹 Range Formation
Price recently consolidated in a defined range between ~40,230 and ~40,400. This range was respected multiple times, showing strong participation from both buyers and sellers.
🔹 Volume Profile Insight
The Point of Control (POC) — marked by the red horizontal line — sits just below the current price level. This is the price area where the highest volume was traded, indicating strong interest and potential future support.
🔹 Trade Idea
A bullish breakout was initiated above the range, targeting the 40,683.64 zone:
Entry: Just above the range high
POC (Support zone): Around 40,231
Stop Loss: Below the POC (~40,141)
Take Profit: Next major resistance (~40,683)
🔹 Current Behavior
Price is now retesting the POC — a critical moment. If it holds, we could see another push higher. A clean breakdown below the POC would invalidate the bullish scenario and suggest sellers are gaining control.
🧠 Key Watch Levels:
Hold of POC = potential long continuation
Break below 40,141 = reevaluate bias
🎯 Reminder: Trade the reaction, not the prediction. Let price confirm your thesis before acting.

US30 - 30 mins candle demand zone potential Potential Demand zone entry IF price hits that level.... Thoughts?

US30 Trade Update- Still MonitoringFollowing up on my earlier analysis, I have not entered a long position yet. While the price action respected the breakout structure, momentum has weakened, and we're currently trading below the New York Opening Range (NY ORB).
I’m holding off on any entries until we get a clean candle close above the NY ORB, which would signal renewed bullish intent. The original setup remains valid, but I’m staying patient and disciplined, waiting for confirmation before committing.
👉 If price continues to break down and fails to reclaim the NY ORB, I won’t be trading US30 for the rest of the day — I’ll let the market do its thing and wait for a better setup.
📌 Reminder: This is my personal analysis, not financial advice. I'm still learning and sharing my process — always do your own research and manage risk accordingly.

YFI/USDTIn this analysis, I’m tracking the recent downtrend on the US30 daily chart. Based on the current pattern and technical indicators (like RSI divergence and a bounce off a key support zone), I expect a potential reversal or at least a short-term correction. Entry signal is marked based on my Smart Bot strategy.

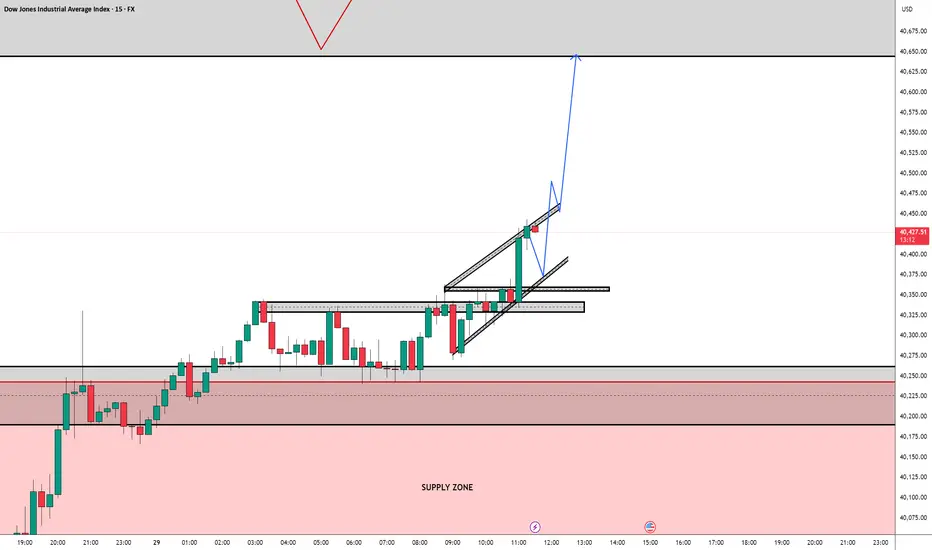
Trade Idea: Long Bias on US30I'm currently monitoring a potential long setup on US30. Price has broken out of a consolidation zone and is respecting an ascending channel. A breakout and retest pattern is forming around the upper trendline, with strong bullish momentum following a clean break of resistance near 40,350. I'm anticipating a brief pullback toward the breakout area (marked by the demand zone and retest block), followed by a continuation to the upside toward the 40,620–40,650 supply zone.
Trade Direction: Long
Entry Zone: 40,350–40,375 (on retest confirmation)
Target: 40,620–40,650
Invalidation: Clean break below 40,300
Context: Strong impulsive breakout + channel breakout with clear liquidity sweep below prior lows.
📌 Disclaimer: This is my personal analysis and should not be taken as financial advice. I’m still learning and refining my strategy — please do your own research and manage your risk carefully.
KEEP BUY ON US30!!!!!!Yesterday us30 completed +3,700pips from my entry point right now we have a liquidity sweep from the sell side am still going long from this point with my initial target at 40,701
JOIN AND ENJOY.........


Potential Formation of a Triangle Pattern ObservedOn the daily timeframe, the Dow Jones movement currently presents two possible scenarios.
Under the black label, there is a potential formation of a triangle pattern, suggesting that the Dow Jones may enter a prolonged consolidation phase to complete wave B, with an expected range between 38,200 and 40,400.
However, under the red label (alternative scenario), a bearish triangle could be forming as part of wave X.


US30 update chart analysis US30 update off Higher Time frames and using FVG,Liquidity Zones, Trend Lines I can see Us30 chasing sellside LQ it can retrace up to Daily Buyside LQ which is 800 pips from current price. the drop is looking like 3k pips close to 4k pips ish. Safe trading.

US30: Next Move Is Up! Long!
My dear friends,
Today we will analyse US30 together☺️
The market is at an inflection zone and price has now reached an area around 39,955.7 where previous reversals or breakouts have occurred.And a price reaction that we are seeing on multiple timeframes here could signal the next move up so we can enter on confirmation, and target the next key level of 40,208.3.Stop-loss is recommended beyond the inflection zone.
❤️Sending you lots of Love and Hugs❤️

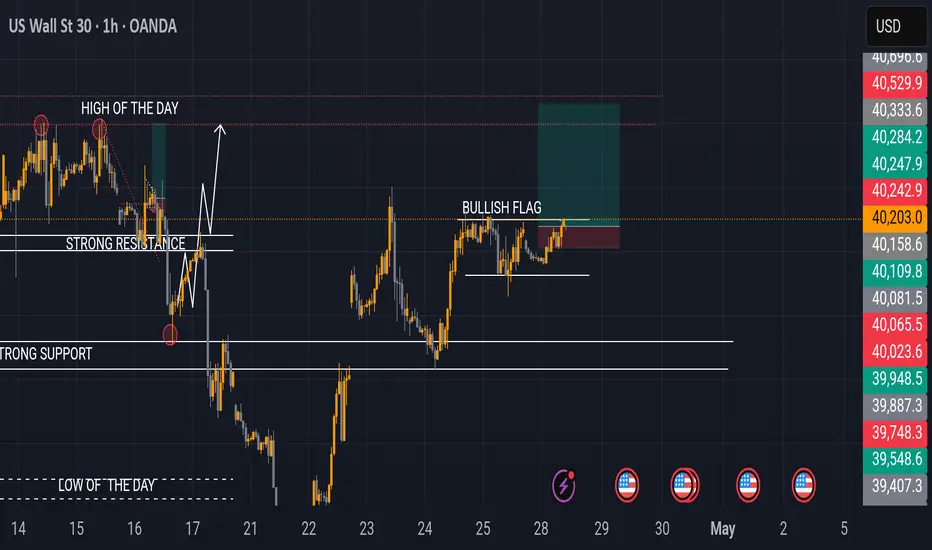
Us300rice pushed above strong support level and now playing within the strong resistance,it formed a bullish continuation patterns so I'm looking for buys
US30 Stuck at Resistance – 28/04/2025🛑 US30 Stuck at Resistance – 28/04/2025 🛑
📈 Big Bounce — But Stuck Below Key Resistance!
US30 has made a strong recovery from 38,000s, but now it’s consolidating right under the 40,260 - 40,360 resistance zone. The bulls are trying to hold above 40,000, but momentum is stalling ⚡.
🔍 Key Observations:
🔹 Price hovering around 40,000
🔹 Major resistance = 40,260 → 40,360
🔹 40,701 is the "final boss" resistance zone
🔹 EMAs (blue/white lines) starting to compress → ⚠️ squeeze coming soon!
🎯 Trade Plan:
🟰 Range between 39,800 - 40,360
🔻 If we reject and lose 39,800 → look for short plays targeting 39,200/38,955
🚀 If we break and close above 40,360 → clean upside toward 40,700+
🧠 Mindset Reminder:
⚡ Tight ranges = avoid overtrading
⚡ Wait for breakout confirmation → momentum will come

US30 TO TANK DOWN!!!??Good day traders, unlike on US100 and S&P500 US30 is showing failure to break higher highs and is forming lower lows using or Golden zones, currently inside the range that i outlined we have a bearish market structure shift, i am expecting the market to tap into our FVG @40075.5 then tank down tho our sellside liquidity @39721.3
ENTRY:40075.5
SL: 40190.0
TP:39721.3

check the trendIt is expected that a trend change will take place at the current resistance level and we will witness the beginning of a correction. If the resistance level is broken, the index can advance to the next resistance level.

A deeper pullback will occur soon!Hello, traders
Based on the chart of the Dow Jones Industrial Average, there appears to be a significant probability of a deeper correction from the current resistance levels. The index has formed what looks like a double top pattern near the 40,400 level, with notable resistance zones highlighted in blue on the chart. After recovering from the early April selloff that took the index down to around 36,600, the Dow has been unable to reclaim previous highs, instead facing rejection at these resistance levels. This price behavior, combined with the technical setup shown on the chart, indicates that we could see a more substantial pullback in the coming sessions if these resistance levels continue to hold.

US30US30 reacted from 38K level as predicted, now correction and further upside towards 41K level.
Disclosure: We are part of Trade Nation's Influencer program and receive a monthly fee for using their TradingView charts in our analysis.

US30 - Signs Point to Deeper Correction AheadBased on the chart of the Dow Jones Industrial Average, there appears to be a significant probability of a deeper correction from the current resistance levels. The index has formed what looks like a double top pattern near the 40,400 level, with notable resistance zones highlighted in blue on the chart. After recovering from the early April selloff that took the index down to around 36,600, the Dow has been unable to reclaim previous highs, instead facing rejection at these resistance levels. This price behavior, combined with the technical setup shown on the chart, indicates that we could see a more substantial pullback in the coming sessions if these resistance levels continue to hold.
Disclosure: I am part of Trade Nation's Influencer program and receive a monthly fee for using their TradingView charts in my analysis.
