APRIL 14TH ANALYSIS FOLLOW THROUGH PT.2I closed my position at 39,100. I can still see it hitting the bull support zone from the channel but I'm happy with 700+ pips bagged for the week. For those that saw this and took advantage CHEERS!! I will be back next week for more analysis.
WS30M trade ideas

Potential bearish drop?DJ30 is reacting off the support level which is an overlap support and could drop from this level to our take profit.
Entry: 39,332.63
Why we like it:
There is an overlap support level.
Stop loss: 40,743.45
Why we like it:
There is an overlap resistance level.
Take profit: 37,047.85
Why we like it:
There is a pullback support level that is slightly below the 61.8% Fibonacci projection.
Enjoying your TradingView experience? Review us!
Please be advised that the information presented on TradingView is provided to Vantage (‘Vantage Global Limited’, ‘we’) by a third-party provider (‘Everest Fortune Group’). Please be reminded that you are solely responsible for the trading decisions on your account. There is a very high degree of risk involved in trading. Any information and/or content is intended entirely for research, educational and informational purposes only and does not constitute investment or consultation advice or investment strategy. The information is not tailored to the investment needs of any specific person and therefore does not involve a consideration of any of the investment objectives, financial situation or needs of any viewer that may receive it. Kindly also note that past performance is not a reliable indicator of future results. Actual results may differ materially from those anticipated in forward-looking or past performance statements. We assume no liability as to the accuracy or completeness of any of the information and/or content provided herein and the Company cannot be held responsible for any omission, mistake nor for any loss or damage including without limitation to any loss of profit which may arise from reliance on any information supplied by Everest Fortune Group.

Dow jones 38500?Dow jones 38500?
The Dow Jones Industrial Average (DJIA) has been experiencing volatility recently, influenced by factors such as weak earnings reports and global economic concerns. The index fell 507 points (1.3%) in its latest session, primarily due to a sharp decline in UnitedHealth shares following an earnings miss

US30selling us30 now 40,320
sl 41,255
tp 37,867
risk 1% each trade .
like an follow for more post.
pre open market setup


DOW/US30Team, time to go long DOW/US30
yesterday the market disappointed on the FED decision,
i just cant believe the FED compare the inflation in 2020-2021 that is where the COVID and lock down. And compare to 2024. he should have cut the interest rate to ease the market.
Given the fact the market is dropping 1000 points, i expect we should have some recover at least 200-300 points medium
Target 1 at 39225
Target 2 at 39335-39420
Target 3 at 39560-39670
We should see the market pump in 2-3 hour time frame or recover.


Dow INTRADAY key resistance at 41333Key Support and Resistance Levels
Resistance Level 1: 41333
Resistance Level 2: 42000
Resistance Level 3: 42800
Support Level 1: 39220
Support Level 2: 37554
Support Level 3: 36620
This communication is for informational purposes only and should not be viewed as any form of recommendation as to a particular course of action or as investment advice. It is not intended as an offer or solicitation for the purchase or sale of any financial instrument or as an official confirmation of any transaction. Opinions, estimates and assumptions expressed herein are made as of the date of this communication and are subject to change without notice. This communication has been prepared based upon information, including market prices, data and other information, believed to be reliable; however, Trade Nation does not warrant its completeness or accuracy. All market prices and market data contained in or attached to this communication are indicative and subject to change without notice.

DOW JONES / US30There is a possibility of price correction from the range of 38903.71 towards 39915 and it can be entered as a trade.

Dow Jones Wave Analysis – 17 April 2025
- Dow Jones reversed from the resistance zone
- Likely to fall to support level 38500.00
Dow Jones index recently reversed down from the resistance zone between the resistance level 40815,00 (former strong support from the start of March), 20-day moving average and the 61.8% Fibonacci correction of the downward impulse from last month.
The downward reversal from this resistance zone stopped the previous minor correction (iv) from the start of April.
Given the clear daily downtrend, Dow Jones index can be expected to fall to the next support level 38500.00.

US30We can attempt to buy US30 from specified level as it make HL , also there is no bearish divergence occur indicate that it moves upward.

US30/ Dow jonesConsidering the high that was hit during London session, I’m waiting to see what happens during the New York session. If that high breaks, I’ll look to buy; if not, I’ll be selling.

US30 Long 15 & 5 min
BLACKBULL:US30
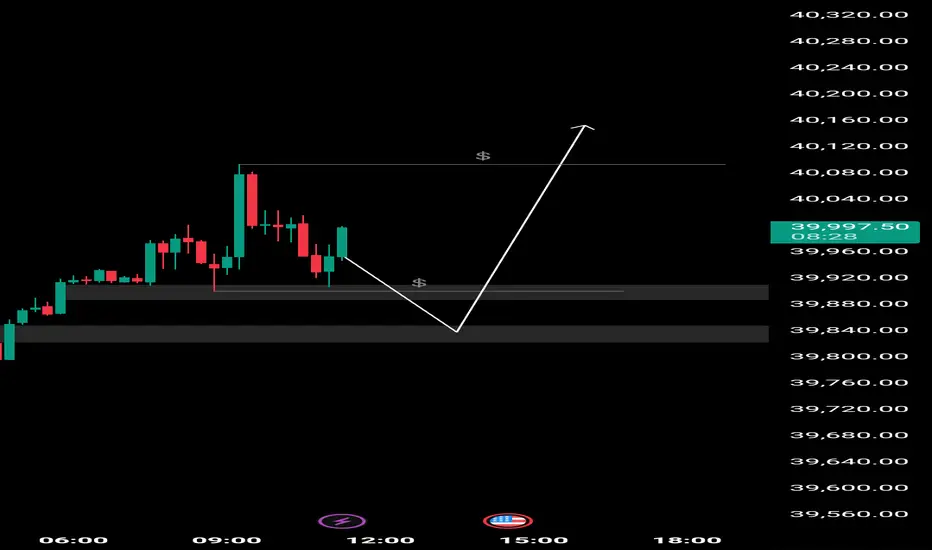
We can see 2 relatively equal lows, which to my opinion may get swept to fill the fair value gap below, and then react to the point that we sweep the swing high
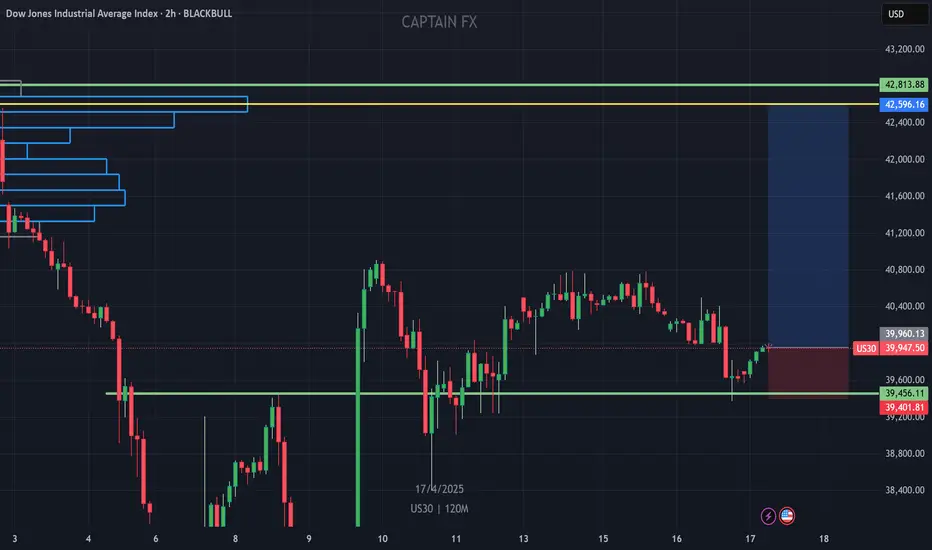
US30 BUY NOW!!!!!!!!US30 created a double bottom on the 2h chart price have already made a retest off the neckline region am in again on buys holding to see price arrive at the POC level
JOIN AND ENJOY........