Nothing lasts forever, Not even this IdeaI would short now, but I'd also put my Stop-loss close, and my TP open, and shift my Stop-loss gradually. this position is risky, but hey no trade is too expensive when you are learning constantly, and acting accordingly.
FXSUSDT trade ideas

Bumpy road to 13$ (4$ - 5$ - 6$ - 7$)According to the information available about #fxs and, market's overall situation which experienced knows about; the real worth for FXS is higher than these prices.
The value increase for FXS will happen one way or another; but, the real question is... if it will be able to hold on to that price level or not? And, the answer to that lies on it's developers and, wether they'll be able to constantly improve this project and resolve future and remaining challenges and obstacles in this project and, develope it's potential to attract more investment, and keep their current investors.
Frax Share 1,104% Target Explained · Scam Wick & MoreFrax Share is starting to recover with strong bullish momentum. The low for this pair was set 3-February with what many people call a "scam wick." Higher lows since. A higher low in March then again in April and June. Only a few pairs completed their lows in February and this is good.
The scam wick was so strong that you can be certain there is no need for prices to go lower again. From now on, we can witness sustained long-term growth.
The "back to baseline" level opens up an easy 224% potential profits. This is the level where you can say, "Ok, I want to triple this Bitcoin with very low risk." And it works like a charm because the action will end up much higher. This is the kind of move that cannot fail. We use spot of course as the whole strategy becomes a simple wait —buy and hold.
The next target gives us 664% and requires the highest prices since May 2022, more than three years. This one is good but some resistance will need to be conquered to get there.
The final target that is mapped on this chart opens 1,104%. This is a strong target but is also do-able. When all is set and done, we can end up with an even higher target. These are only conservative projections and hard to miss. I cannot say with a high level of certainty how far up Frax Share will go, the chart is a bit strange, but I can say with 100% level of certainty that we are entering a major bullish wave. 500% to 1,000% growth is an easy guess. Anything extra is welcomed and accepted.
Thank you for reading.
Namaste.

FXS/USDT – Long-Term Accumulation Base Ready for Takeoff🧠 Overview:
Frax Share (FXS) has been consolidating in a long-term accumulation phase, forming a strong base in the $1.24 – $2.54 zone for over a year. This prolonged sideways movement suggests institutional accumulation and a potential macro reversal, especially as the price is tightening near a major descending trendline that has acted as dynamic resistance since early 2022.
The chart is setting up for what could be a massive bullish breakout, with multiple confluences aligning technically and psychologically.
🧱 Technical Structure & Pattern Analysis:
Pattern: The chart shows signs of a falling wedge combined with a horizontal accumulation base, which is typically a bullish reversal structure.
Descending Trendline: The yellow diagonal trendline has been respected for over 2 years. Price is now coiling below it, hinting at a potential volatility expansion.
Accumulation Range: Price has consistently respected the $1.24 – $2.54 support range (highlighted in yellow), forming a multi-touch base, which strengthens the validity of this demand zone.
Volume: While volume isn't shown, such long consolidations often coincide with volume contraction, followed by explosive moves when volume returns.
🟢 Bullish Scenario (High Probability):
1. Breakout Above $2.54 confirms exit from the accumulation range.
2. Initial targets:
$4.16 – Previous resistance + psychological round level
$7.46 – Major horizontal S/R flip
$10.39 – Weekly supply zone
3. Mid to Long-Term Targets:
$17.40 – Pre-breakdown support from 2022
$38.35 and even $46.00 – Full bullish cycle potential (ATH zone)
📌 Catalyst: A weekly candle close above $2.54 with increased volume could trigger a cascade of bullish momentum and possibly attract large buyers or breakout traders.
🔴 Bearish Scenario (Low Probability but Must Consider):
1. Breakdown below $1.24 would invalidate the base and potentially lead to:
Retesting uncharted lows near $1.00 or lower
Loss of investor confidence in the short to mid term
2. Such a move could suggest distribution rather than accumulation, but this currently lacks confirmation from price action.
🧠 Strategic Insight:
This chart is a textbook example of “High Risk, High Reward”. Smart traders and swing investors often hunt for assets in deep accumulation zones with favorable reward-to-risk setups — and FXS fits this criterion perfectly.
Entering on retests above $2.54 or accumulating in the current zone with tight stop-losses below $1.24 offers compelling upside with controlled downside.
📊 Key Technical Levels to Watch:
Level Description
$1.24 - $2.54 Demand Zone / Accumulation Base
$2.54 Breakout Confirmation Level
$4.16 First Key Resistance
$7.46 Major Resistance
$10.39 Mid-Term Bull Target
$17.40 Pre-breakdown Zone
$38.35 - $46 Long-Term Bull Cycle Target
🧭 Conclusion:
FXS is quietly preparing for a major breakout move, and the current chart setup indicates that patient accumulation might soon pay off. Whether you're a technical trader, long-term investor, or a crypto strategist, FXS deserves a spot on your watchlist right now.
This could be one of those “before the hype” moments — don’t miss it.
#FXS #FXSUSDT #CryptoBreakout #AltcoinSetup #TechnicalAnalysis #Accumulation #FallingWedge #BullishCrypto #CryptoChart #FXSTechnical #SwingTrade

FXS TO THE WHITE LINEWe were in and booked partial earlier , now again entered
FXSUSD Long
📦 Entry Zone: $3.0237 (Marked on chart)
🎯 TP1: $3.207
🎯 TP2: $3.487
❌ SL: $2.7760
🧠 Strategy:
✅ Use low leverage
✅ Risk only 2–5% per trade
⚠️ Stick to the plan — no chasing trades.
Discipline = Consistency 💹
TuffyCalls Team

FXSUSDT 1W AnalysisFXS ~ 1W Analysis
#FXS Buy after successfully breaking through this resistance line if you still have confidence in this coin with a short-term target of at least 20%++

FXS/USDTKey Level Zone: 2.8080 - 2.8350
HMT v8.1 detected. The setup looks promising, supported by a previous upward/downward trend with increasing volume and momentum, presenting an excellent reward-to-risk opportunity.
HMT (High Momentum Trending):
HMT is based on trend, momentum, volume, and market structure across multiple timeframes. It highlights setups with strong potential for upward movement and higher rewards.
Whenever I spot a signal for my own trading, I’ll share it. Please note that conducting a comprehensive analysis on a single timeframe chart can be quite challenging and sometimes confusing. I appreciate your understanding of the effort involved.
Important Note :
Role of Key Levels:
- These zones are critical for analyzing price trends. If the key level zone holds, the price may continue trending in the expected direction. However, momentum may increase or decrease based on subsequent patterns.
- Breakouts: If the key level zone breaks, it signals a stop-out. For reversal traders, this presents an opportunity to consider switching direction, as the price often retests these zones, which may act as strong support-turned-resistance (or vice versa).
My Trading Rules
Risk Management
- Maximum risk per trade: 2.5%.
- Leverage: 5x.
Exit Strategy
Profit-Taking:
- Sell at least 70% on the 3rd wave up (LTF Wave 5).
- Typically, sell 50% during a high-volume spike.
- Adjust stop-loss to breakeven once the trade achieves a 1.5:1 reward-to-risk ratio.
- If the market shows signs of losing momentum or divergence, ill will exit at breakeven.
The market is highly dynamic and constantly changing. HMT signals and target profit (TP) levels are based on the current price and movement, but market conditions can shift instantly, so it is crucial to remain adaptable and follow the market's movement.
If you find this signal/analysis meaningful, kindly like and share it.
Thank you for your support~
Sharing this with love!
HMT v2.0:
- Major update to the Momentum indicator
- Reduced false signals from inaccurate momentum detection
- New screener with improved accuracy and fewer signals
HMT v3.0:
- Added liquidity factor to enhance trend continuation
- Improved potential for momentum-based plays
- Increased winning probability by reducing entries during peaks
HMT v3.1:
- Enhanced entry confirmation for improved reward-to-risk ratios
HMT v4.0:
- Incorporated buying and selling pressure in lower timeframes to enhance the probability of trending moves while optimizing entry timing and scaling
HMT v4.1:
- Enhanced take-profit (TP) target by incorporating market structure analysis
HMT v5 :
Date: 23/01/2025
- Refined wave analysis for trending conditions
- Incorporated lower timeframe (LTF) momentum to strengthen trend reliability
- Re-aligned and re-balanced entry conditions for improved accuracy
HMT v6 :
Date : 15/02/2025
- Integrated strong accumulation activity into in-depth wave analysis
HMT v7 :
Date : 20/03/2025
- Refined wave analysis along with accumulation and market sentiment
HMT v8 :
Date : 16/04/2025
- Fully restructured strategy logic
HMT v8.1 :
Date : 18/04/2025
- Refined Take Profit (TP) logic to be more conservative for improved win consistency

$FXS Setup Heating Up CRYPTOCAP:FXS Setup Heating Up 🔥
CRYPTO:FXSUSD is holding strong above the breakout zone near $3 after a clean retest.
As long as it stays above this support, the setup looks bullish with a potential 100% move toward $6.20.
Momentum is building, one to keep an eye on!
DYRO, NFA

#FXS/USDT#FXS
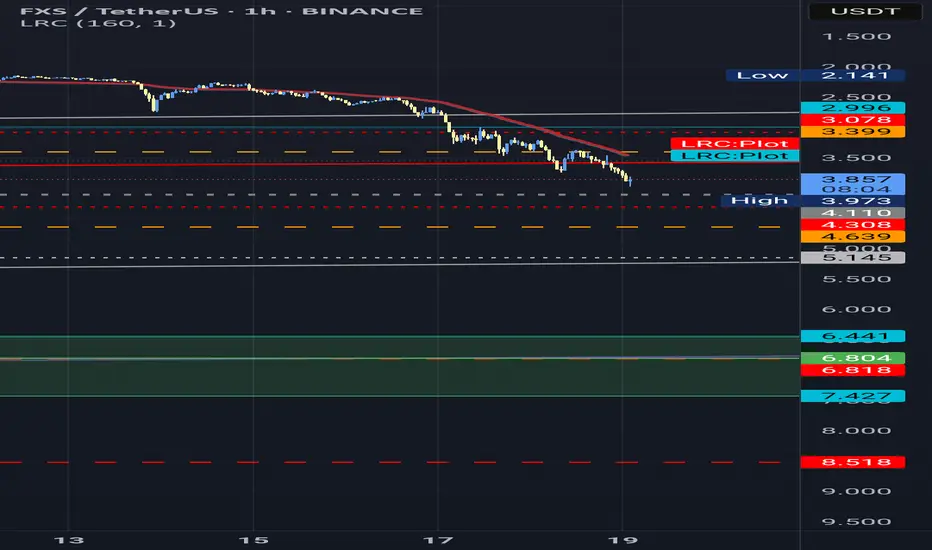
The price is moving within a descending channel on the 1-hour frame, adhering well to it, and is heading for a strong breakout and retest.
We are experiencing a rebound from the lower boundary of the descending channel, which is support at 3.70.
We are experiencing a downtrend on the RSI indicator, which is about to break and retest, supporting the upward trend.
We are looking for stability above the 100 Moving Average.
Entry price: 3.75
First target: 3.96
Second target: 4.13
Third target: 4.37

FXSUSDT 1D#FXS is on the verge of breaking out above the neckline of the rounding bottom pattern and the descending resistance on the daily timeframe. In case of a breakout, the targets are:
🎯 $4.098
🎯 $4.934
🎯 $6.073
🎯 $7.212
⚠️ Use a tight stop-loss.

Frax Share On The Way Up (PP: 270%)The low here happened 11-March rather than 7-April, 7-April was a higher low. The action is strongly bullish and the rising channel has been broken, the upper boundary. From this we can deduct that the next higher high will be a really strong one.
Frax Share is on the way up.
The $11.33 target with 270% potential on the chart gives 809% potential when taken from the 11-March low. This is the projected size of this first 2025 bull market advance. Of course it can happen that the peak reaches $7.47.
The first peak can be $7.47 or $11.33 doesn't matter. After the higher high is in, we are likely to experience a retrace or correction followed by additional growth. This "additional growth" will result in something really huge. It will be awesome.
Prepare now, many Altcoins are still trading at bottom prices.
Plan before buying. When will you sell if prices start to rise after you bought?
How much will you sell?
If you don't sell everything, what will you do with the remaining tokens?
If you sell everything, what will you do with the free capital? Use a portion to enter a new trade while securing some profits? Go all in a new trade or split between multiple pairs?
Plan for all scenarios.
Create your own scenarios. This way you can win big.
Namaste.

Can #FXS Bulls Make a Comeback? Key Levels to Watch Yello Paradisers! Is #FXS gearing up for a massive breakout? Or will the bears take full control? Here’s what’s happening right now with #FraxShare (FXSUSDT) and why this next move could be crucial:
💎#FXSUSDT has been stuck in a descending triangle pattern, consistently rejecting off its downward resistance line. This structure suggests a squeeze is coming, and a decisive break will set the tone for the next big move. Currently, #FXS is hovering near a strong support zone at $1.53, where buyers are stepping in.
💎A bullish divergence on the histogram is forming, hinting at a potential momentum shift. But for bulls to take charge, #FXSUSD must break above the descending resistance and reclaim $3.32. If this level is flipped into support, we could see a strong rally toward the $5.32 resistance zone, where heavy selling pressure might re-emerge.
💎However, if #FXS fails to hold above $1.53, the bullish setup will weaken, increasing the risk of further downside. A breakdown below this level would expose the next major support at $0.36—a level where panic could set in, leading to a sharp sell-off.
💎The battle between bulls and bears will reach a climax at $0.36 because if it fails, the bears will be in total control, invalidating the bullish setup.
Stay focused, patient, and disciplined, Paradisers🥂
MyCryptoParadise
iFeel the success🌴

#FXSUSDT There is a possibility of forming a triangle. It is necessary to observe the loss limit of 1.5 dollars

FXS/USDTKey Level Zone: 3.2600 - 3.3100
Stoploss Level: 3.2260
HMT v4.1 detected. The setup looks promising, supported by a previous upward/downward trend with increasing volume and momentum, presenting an excellent reward-to-risk opportunity.
HMT (High Momentum Trending):
HMT is based on trend, momentum, volume, and market structure across multiple timeframes. It highlights setups with strong potential for upward movement and higher rewards.
Whenever I spot a signal for my own trading, I’ll share it. Please note that conducting a comprehensive analysis on a single timeframe chart can be quite challenging and sometimes confusing. I appreciate your understanding of the effort involved.
Important Note :
Role of Key Levels:
- These zones are critical for analyzing price trends. If the key level zone holds, the price may continue trending in the expected direction. However, momentum may increase or decrease based on subsequent patterns.
- Breakouts: If the key level zone breaks, it signals a stop-out. For reversal traders, this presents an opportunity to consider switching direction, as the price often retests these zones, which may act as strong support-turned-resistance (or vice versa).
My Trading Rules
Risk Management
- Maximum risk per trade: 2.5%.
- Leverage: 5x.
Exit Strategy
Profit-Taking:
- Sell at least 70% on the 3rd wave up (LTF Wave 5).
- Typically, sell 50% during a high-volume spike.
- Adjust stop-loss to breakeven once the trade achieves a 1.5:1 reward-to-risk ratio.
- If the market shows signs of losing momentum or divergence, ill will exit at breakeven.
The market is highly dynamic and constantly changing. HMT signals and target profit (TP) levels are based on the current price and movement, but market conditions can shift instantly, so it is crucial to remain adaptable and follow the market's movement.
If you find this signal/analysis meaningful, kindly like and share it.
Thank you for your support~
Sharing this with love!
HMT v2.0:
- Major update to the Momentum indicator
- Reduced false signals from inaccurate momentum detection
- New screener with improved accuracy and fewer signals
HMT v3.0:
- Added liquidity factor to enhance trend continuation
- Improved potential for momentum-based plays
- Increased winning probability by reducing entries during peaks
HMT v3.1:
- Enhanced entry confirmation for improved reward-to-risk ratios
HMT v4.0:
- Incorporated buying and selling pressure in lower timeframes to enhance the probability of trending moves while optimizing entry timing and scaling
HMT v4.1:
- Enhanced take-profit (TP) target by incorporating market structure analysis

FXS/USDTKey Level Zone : 3.700 - 3.870
HMT v3.0 detected. The setup looks promising, supported by a previous upward/downward trend with increasing volume and momentum, presenting an excellent reward-to-risk opportunity.
HMT (High Momentum Trending):
HMT is based on trend, momentum, volume, and market structure across multiple timeframes. It highlights setups with strong potential for upward movement and higher rewards.
Whenever I spot a signal for my own trading, I’ll share it. Please note that conducting a comprehensive analysis on a single timeframe chart can be quite challenging and sometimes confusing. I appreciate your understanding of the effort involved.
If you find this signal/analysis meaningful, kindly like and share it.
Thank you for your support~
Sharing this with love!
HMT v2.0:
- Major update to the Momentum indicator
- Reduced false signals from inaccurate momentum detection
- New screener with improved accuracy and fewer signals
HMT v3.0:
- Added liquidity factor to enhance trend continuation
- Improved potential for momentum-based plays
- Increased winning probability by reducing entries during peaks

Frax Share (FXS)FXS Analysis 📈🔥
Introduction
FXS (Frax Share) is one of the key cryptocurrencies in the DeFi space, offering a cohesive ecosystem with innovative decentralized finance (DeFi) mechanisms and a robust tokenomics structure. It has secured a prominent place among similar projects. Currently, FXS is trading within a descending channel and is approaching a significant PRZ zone (green zone). If this zone is broken, we could expect a strong upward movement. Let’s dive deeper into the technical analysis of FXS’s price action 🚀📊.
Technical Analysis (TA)
Key Supports:
FXS is currently within a descending channel, nearing its upper boundary. The green zone, which includes both weekly resistance and the top of the descending channel, is a crucial PRZ (Price Reversal Zone). This zone is significant due to the confluence of several key technical levels, such as weekly resistance and the channel's upper boundary.
If the price breaks through this zone 💥, we could see strong buying pressure enter the market, triggering a notable upward move. However, if the price gets rejected from this zone 🚫, we may see a continuation of the bearish trend or a deeper correction. Thus, this zone represents a critical turning point for determining the price’s direction.
Key Resistances:
If the green zone is broken, the following Fibonacci target levels could be reached:
1.272: (between 10.058 and 11.770)
1.618: (between 17.252 and 20.414)
2.272: (between 38.696 and 46.175)
These levels are considered potential targets for the next upward move 🚀. It's essential to pay attention to trading volume in this zone, as an increase in volume would confirm the strength of the buying pressure and a possible breakout. A significant volume surge, especially above the average daily volume, can be indicative of the start of a larger upward trend.
Predicted Critical Scenarios:
1. If the price is rejected from the PRZ zone:
In the event of a rejection from the green zone 🚫, we could see a deeper correction toward the gray zone (between 1.541 and 1.813). If this area fails to hold, there is a risk of further correction toward the lower boundary of the descending channel ⚠️. In this scenario, it’s important to watch for reversal signals at these levels.
RSI Indicator:
The RSI is currently moving within a descending channel with a mild slope 📉. A breakout from this channel to the upside 💥 could indicate a move into the overbought (Overbuy) territory, potentially accelerating the upward movement of the price 🚀. However, if the RSI continues its downward trend, we may need to watch for lower support zones.
Investment Strategy:
Step-by-Step Entry:
The best strategy in this situation is to enter gradually 🪜. You can start entering around support zones with reasonable volume and strengthen your position once the green zone breaks. This strategy allows you to manage risk more effectively and take advantage of any price rallies.
Risk Management:
To manage risk 🛡️, it’s advisable to set your stop-loss in lower support areas such as 1.541 – 1.813. This helps mitigate potential losses in case negative scenarios unfold.
Volume Analysis:
Trading volume is a key factor for confirming breakouts or trend continuations. If we see an increase in volume within the PRZ zone 📈, the likelihood of a breakout and a subsequent upward move increases. Any unexpected volume spike should be carefully monitored.
Conclusion:
FXS is at a crucial point in its price action. Given the technical analysis and current conditions, employing a step-by-step entry strategy and managing risk can help you take full advantage of this opportunity 💡. Additionally, paying attention to the PRZ zones, volume analysis, and RSI is essential for navigating this trade. These key points can guide you in making well-informed decisions for the future 🚀.

FXSUSDT (FraxFinance) Updated till 25-12-24FXSUSDT (FraxFinance) Daily timeframe range. PA here is trying to retrace back to its last range high. if it can stay above 3.921 it sure can reach there. little bit more volume would pick things up more easily. recent support at 2.466.

FXS superFXS has printed good buy and Fbuy prints. With superb volume we can expect that it can reach the supply zone of 3.4 - 3.6 area.
DYOR
For indicator access you can drop a message.

FXS Breakout Wedge PatternFXS breakout wege pattern in mid timeframe
I think it could retest then up only if not back to range wedge

Are We on the Verge of a Major FXSUSDT Shift? - Frax Share◳◱ On the BINANCE:FXSUSDT chart, the Bband Breakout pattern suggests a consolidation phase that could precede a trend continuation or reversal. Traders might observe resistance around 3.366 | 4.186 | 5.572 and support near 1.98 | 1.414 | 0.028. Entering trades at 3.383 could be strategic, aiming for the next resistance level.
◰◲ General Information :
▣ Name: Frax Share
▣ Rank: 275
▣ Exchanges: Binance, Kucoin, Huobipro, Gateio, Mexc, Hitbtc
▣ Category / Sector: Financial - Stablecoins
▣ Overview: Frax attempts to be the first fractional-algorithmic stablecoin protocol to implement design principles of both collateralized and algorithmic stablecoins. The Frax protocol is a two token system - the stablecoin FRAX, and Frax Shares (FXS), which are used to stablise the system, accrue seigniorage revenue and fees, as well as provide governance rights. The degree to which FRAX is collateralized is determined by market forces, with the collateral ratio determining the proportion of FRAX outstanding to be backed by collateral, with the remainder in FXS.
◰◲ Technical Metrics :
▣ Current Price: 3.383 ₮
▣ 24H Volume: 47,158,096.844 ₮
▣ 24H Change: 34.299%
▣ Weekly Change: 0.52%%
▣ Monthly Change: 29.85%%
▣ Quarterly Change: 71.48%%
◲◰ Pivot Points :
▣ Resistance Level: 3.366 | 4.186 | 5.572
▣ Support Level: 1.98 | 1.414 | 0.028
◱◳ Indicator Recommendations :
▣ Oscillators: BUY
▣ Moving Averages: STRONG_BUY
◰◲ Summary of Technical Indicators : BUY
◲◰ Sharpe Ratios :
▣ Last 30 Days: 1.04
▣ Last 90 Days: 1.40
▣ Last Year: -0.92
▣ Last 3 Years: -0.04
◲◰ Volatility Analysis :
▣ Last 30 Days: 1.45
▣ Last 90 Days: 1.10
▣ Last Year: 0.96
▣ Last 3 Years: 1.13
◳◰ Market Sentiment :
▣ News Sentiment: N/A
▣ Twitter Sentiment: N/A
▣ Reddit Sentiment: N/A
▣ In-depth BINANCE:FXSUSDT analysis available at TradingView TA Page
▣ Your thoughts matter! What do you think of this analysis? Share your insights in the comments below. Your like, follow, and support are greatly valued and help sustain high-quality content.
◲ Disclaimer : Disclaimer
The content provided is for informational purposes only and does not constitute financial, investment, or trading advice. Always conduct your own research and consult a qualified professional before making any financial decisions. Use of the information is solely at your own risk.
▣ Explore the Power of Charting with TradingView
Unlock a wide range of financial analysis tools, data, and features to elevate your trading experience. Take a tour and see the possibilities. If you decide to upgrade your plan, you can receive up to $30 back. Discover more here - affiliate link -

TradeCityPro | FXS : Signs of a Bullish Momentum Surge👋 Welcome to TradeCityPro!
In this analysis, I will evaluate the FXS token. This token belongs to the Frax project, which is considered one of the most comprehensive protocols in DeFi. It could be a strong investment for a bullish market portfolio.
📅 Weekly Timeframe: Early Signs of Bullish Momentum
On the weekly timeframe, we observe significant selling pressure right from the beginning of the chart. This selling pressure has driven the price down twice: once from the 38.917 resistance to the 4.468 support, and again from 11.859 to 1.613. Notably, this is one of the few coins that has yet to revisit the lows it formed in early 2023.
📊 Despite the significant decline, market volume has consistently increased, and overall, buying volume has been greater than selling volume.
📈 Currently, in line with Bitcoin’s upward movement, FXS has also rebounded from its 1.613 low and climbed to the 4.468 zone. This upward movement occurred after breaking the 34.90 resistance on the RSI, which introduced considerable bullish momentum into the market.
✅ If the 4.468 resistance is broken, the next targets are 7.515 and 11.859. These two resistances mark the goals for the next upward movement if it continues, with 11.859 being a key critical resistance for this coin.
🚀 Breaking the 11.859 resistance will be challenging. However, if the market gains substantial momentum, FXS could break through all resistances with a large bullish candle and head towards higher targets. On the other hand, a gradual and steady approach towards this level would make breaking it significantly harder.
🔼 If this resistance is broken, additional bullish momentum could enter the market, enabling the price to move towards the 38.917 zone and potentially reach new all-time highs (ATH).
🔍 To explore more scenarios, let’s examine the daily timeframe for detailed insights.
📅 Daily Timeframe: Struggling Against Key Resistance
In the daily timeframe, the latest upward movement in price is visible in more detail. As seen, after the last touch at 1.613, there was a massive and notable increase in buying volume. However, upon reaching the 4.819 resistance, a Blow Off candle was formed, marking the end of this trend’s upward leg.
📉 Currently, the price is in a corrective phase and has fallen below the 3.97 zone. If the correction continues, there is a significant resistance zone close to the 2.346 support level that I’ve highlighted. Should the RSI stabilize below the 53.46 support level, the likelihood of a deeper correction will increase.
🧩 Conversely, if the 4.819 resistance is broken, we could expect another rally for the price. The targets for this rally have been identified in the weekly timeframe analysis
📝 Final Thoughts
This analysis reflects our opinions and is not financial advice.
Share your thoughts in the comments, and don’t forget to share this analysis with your friends! ❤️ above.

FXS Keep it Simple Stupid Levels based on Volume ProfileFXS Announcement Week Support and Resistance areas based on volume profile simplified for visuals

Keeping an eye on #FXS/USDT Diagonal trendline in 4-Hour TF!Keeping an eye on #FXS/USDT Diagonal trendline in 4-Hour TF!
I will be looking for a short position in $FXS. Added some in-spot bags too. The local support level is PWH $3.809.
