GALA.Usdt (Y22.P1.E1).When to shortHi All,
Like most charts now, its difficult to find an entry.
We have a 50/50 chance to go either way, just like BTC .
If it breaks below, then its worth the trade and have a tight stop loss as it could be a fake out.
Just depends how it does it.
The structure is like a reversal but one can't be sure of anything when it comes to these formations.
I did miss that move to the upside as I wasn't watching it when that hour was needed.
All the best,
S.SAri
GALAUSD trade ideas

Game plan for GALA _ Update _ The breakthrough occurred exactly at the point I pointed out in the previous idea.
If it is valid, it can go up.
At the moment, however, the complete market is in the decisive phase of which direction to decide.

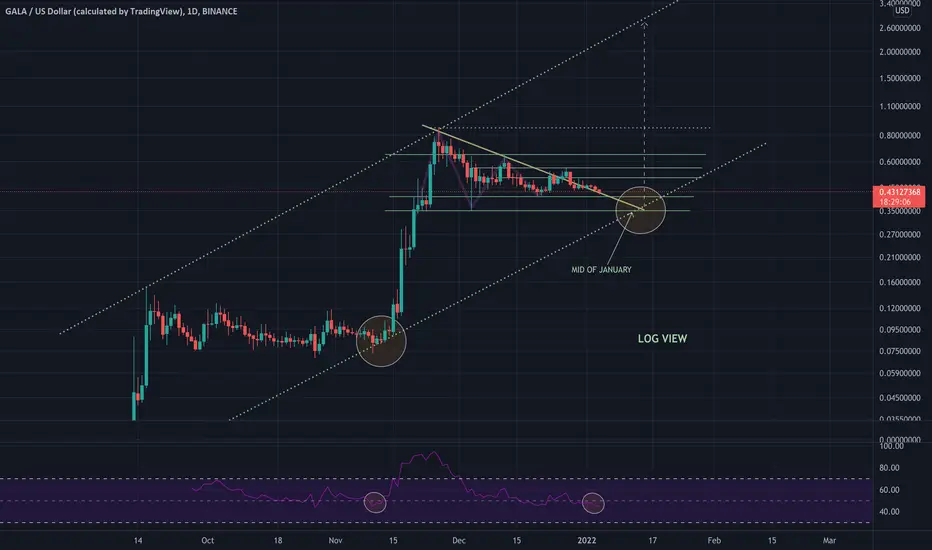
GALA: PennantLog scale shows a massive pennant forming for GALA. If the lower trend line holds and BTC remains bullish, there is a possible bullish breakout that could be coming in the next few weeks.
Invalid if the lower trend line breaks. Major horizontal support around $.18

GALAGALA balances on the edge of support and decides which target to go for.
Not the financial board.
Just for fun.

GALA: InvertedI like to invert the charts sometimes for a different perspective. We can see that on the inverted chart, GALA was in a massive rising wedge for about 75 days, broke down, and looks to be in another possible rising wedge.
It'll be interesting to see where GALA is later this year.
Happy trading :-)

EYES on gala for bounce at 22 centsEYES on gala for bounce at 22 cents with a potential wick to about 15 cents. She's a wicker

GALAWas asked to chart this shitcoin
Down before up
BTC to 10-15k would rekt it to
NOT TARDING ADVICE
GRI 2022

GALA: Signs of StrengthGALA has been in a downtrend for about 66 days. I have my fib measured to the ATH candle close (not the wick), and the .786 held when BTC fell to $33K.
So, is this considered the start of a reversal?
There are signs that are pointing in that direction:
Daily RSI was heavily oversold and has broken the downtrend
The main downtrend line of resistance has been broken as well
.786 fib held and bounced above the .618
For now, GALA is looking strong, and I'm long-term bullish on the Metaverse projects. Short-term movement will depend on BTC's position.
This is not financial advice. These are just my ideas and opinions.

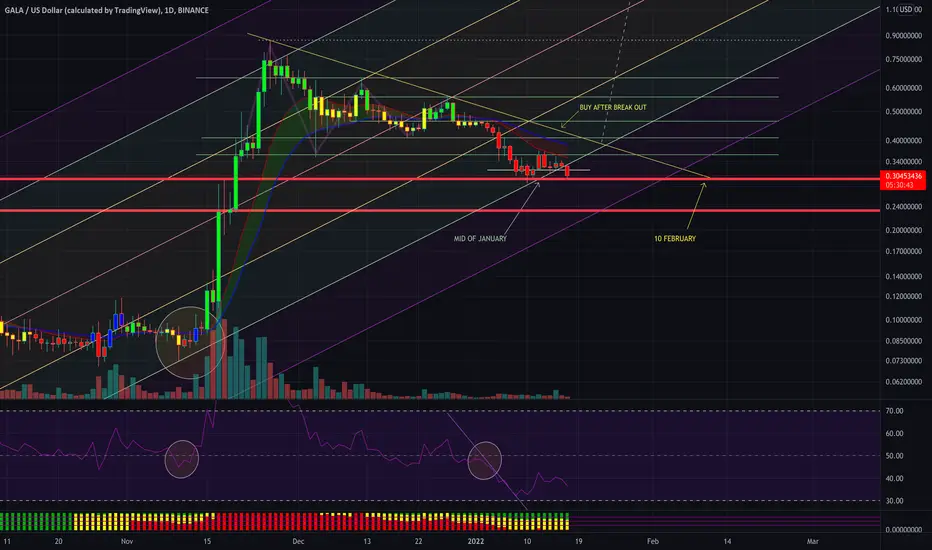
GALA : WHEN TO EXPECT A DECISION? Gala has gone off track (the track i draw in previous analysis)
I extend it and discover it has the same timeline with BTC ichimoku cloud
(See below) ... So it may sideway longer
.
- Don't buy until break up descending triangle
.
Trade safe and fun <3
Feel free to feedback /comment
GALA - THE CORRECTION CONTINUES! So What's Next?Happy Icy Texas Friday, Traders!
Hope you find value from this post.
If you did, pls like and consider following.
Here's a trading idea.
But firstly...
==============================
Quick Disclaimer:
Trade at your own risk. This post/chart is for your reference only, it is not intended as a recommendation, nor is it an advice to sell nor buy this crypto asset, nor to place any trade.
Trading poses a risk of losing some or all of your money and it will be your responsibility if you lose money.
I am not trading this asset but TA on this asset has been requested, so it is my pleasure to present my views on this GALA/USD pair.
==============================
4 HOUR CHART:
After being rejected at the Red Resistance Trend Line and its 21MA, GALA has dipped down towards the support lines, and the support bar.
Three things can happen now...
A: GALA bounces off the Green Extended Support Trend Line and move back up towards its 21MA and resistance trend line and maybe, just maybe it could finally push out of this Falling Wedge pattern towards the upside.
B: GALA could continue crawling downwards inside the falling wedge.
C: GALA could break the Green Extended Support Trend Line and dip further down towards the 84% Fib @ 0.1934.
MACD: If GALA manages to keep its level above 0.02570530 then it will maintain its Bullish Divergence against the price action.
Stoch RSI: Stoch RSI on this chart is still at the Oversold Region.
My conservative move on GALA would have to be to wait for price to go above its 21MA and exit the resistance prior to entering a long position.
Price action is KING!
Always remember to place your Stop Loss.
Patience and Discipline are KEYS to a successful trade.
Trading is both a Science and an Art.
Develop an intuition and listen to your instinct while following the rules putting emotions aside.
If you have not yet developed it, you will develop this as long as you stay consistent with following
the rules. The skills will become second nature to you much like how you acquire the skill in riding a bicycle.
Soon it will be your subconscious running your trades, again, much like when riding a bicycle
the balancing is controlled by the subconscious part of your brain.
Be PERSISTENT and stay PERSISTENT.
Let me know what asset you wish for me to look at and evaluate for potential long set ups and I will post it here on TradingView.
If you found value from this post, consider giving it a like and subscribe. Furthermore, share it with someone you know will benefit from this.
More power to all your trades, my friends!
Ron
Intrepid_Trader

GALA : UPDATEDUpdate of support, resistance,RSI in long term view
.
All the coin's following BTC
Trade safe always place to stop loss and money/risk management
Feel free to feedback & comment.
:)
P.S. i'm a fan of Zynga and that will never change (their games)
Mil
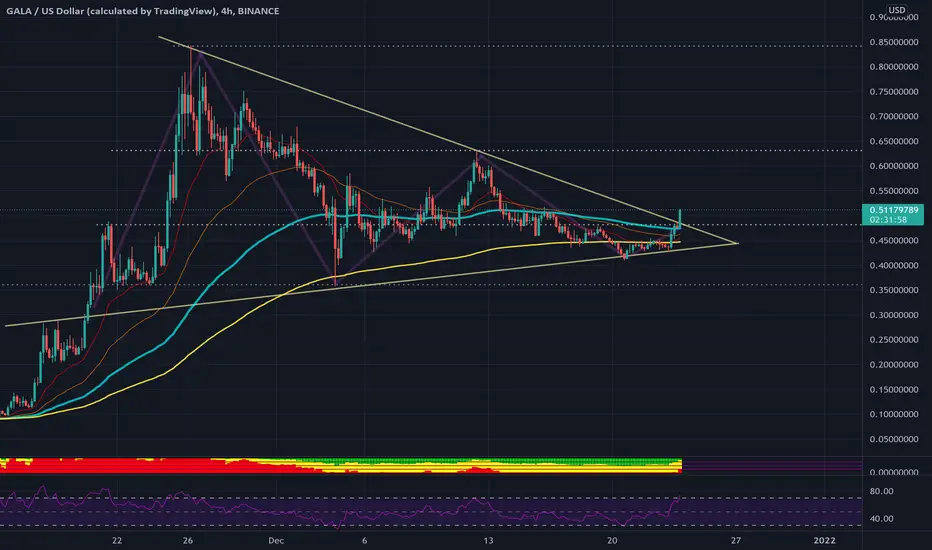
Short idea for GALA - triangle (1H)I would like to share this short idea for GALA. It's moving in a triangle pattern, so now there is a high probability that the price will go down until the bottom support line. The RSI and MACD indicators are also confirming the predicted move.
Trend: downtrend (50 EMA < 100 EMA < 200 EMA on the hourly chart)
Nice and easy trading opportunity.
Entry level: if price goes below 0.341
SL/TP levels are shown on the Short position drawing.
Good luck!

GALA: Falling WedgeAfter more than a 60% drop from its all-time high, GALA is tightening up in a falling wedge pattern. This pattern is bullish.
Once BTC starts to show strong reversal signs to the upside, we should see a strong push on the alt coins as well.
This is not financial advice. These are just my ideas and opinions.


GALA Long Idealittle gamble GALA Long Idea.
Gala (GALA) is unchanged at $0.437 (+0.05%) in early trading Thursday, down 14% in the last 7-days and -30% in December. Due to the poor performance this week, the gaming and NFT platform’s market cap has fallen to approximately $3 billion ($5.7b last month), ranking its native GALA token the 50th most valuable cryptocurrency behind EOS.
Similar to other gaming-related cryptocurrencies, like The Sandbox (SAND) and Decentraland (MANA), Gala Games has erased a large portion of the gains it made last month. Several factors are responsible for the decline in gaming cryptos over the previous four weeks. Firstly, the massive influx of capital into the sector stretched valuations to unrealistic levels. Secondly, the crypto market as a whole has turned lower in December as fears over central bank policy tightening encourages profit-taking. Subsequently, the Gala price action suggests holders are trying to offload tokens at increasingly lower levels.

TRIPPLE BOTTOM ON GALAHello guys. a looking into GALA , from the chart am seeing a strong support zone. if it holds that will be a good run to the upside. have a look.
tradehubng,

#GALAPERP Long RR:2.86 Stop:%8After the reaction from RL, I am thinking of evaluating it up to the RH region with EQ gain, since it progressed by doing HL.

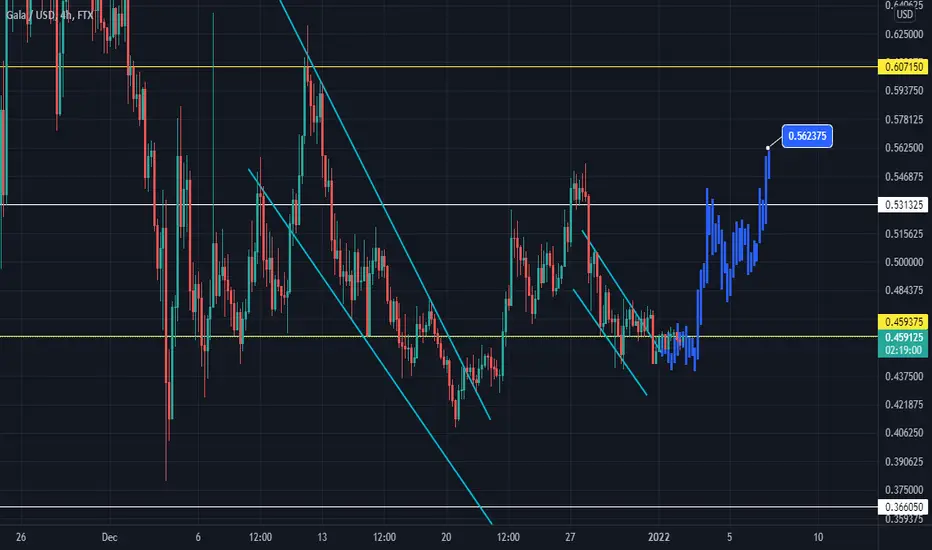

Gala token price prediction 27/12/ 2021Spotted inverted head and shoulders for Gala in the 4hr time frame. If we extend out , it rest nicely on the Fibonacci 0.5 price ;evel of &0.61.
Currently the price is in consolidating phase. Let see in 48hrs. The char price prediction may not materialize if bitcoin start losing strength.

GALA - Potential Long SetupGALA seems to be holding here after coming down slightly lower than my short target (albeit within range). Basically, you can try to target the flipping of the purple line, which is the 50ema. I went long earlier, but I think .52 is the safe entry here with a stop at .48 , NFA , DYOR. Watch BTC for guidance.

GALA : Accurate chart is on Binance Hi everyone,
Different exchange = different chart.
(it can be big different if you compare)
For Gala this one's the best.
.
I can't add comment with pic in my previous post
but i did comment many candlesticks that fell off trend, actually they're not.
:) Just in case u followed the previous analysis!
so this's gonna be my last fix for "GALA"
.
In Zynga...I trust .............. for just only 1$ may be :P
Enjoy Trading <3 Stay Safe with stop loss
.
Mil
***Dotted line in grey are resistances/ TP
GALA: patiently waiting for final flush to go longHave been tracking GALA since buying at .22 and selling at .80. Expect final leg lower on this correction which will present excellent buy op for the run to $1-1.20 or so. Good Luck!
