GALA : Sell Disclaimer
High Risk Investment
Trading cryptocurrencies and Forex carries a high level of risk, and may not be suitable for all investors. Before deciding to trade cryptocurrency you should carefully consider your investment objectives, level of experience, and risk appetite. The possibility exists that you could sustain a loss of some or all of your initial investment and therefore you should not invest money that you cannot afford to lose. You should be aware of all the risks associated with cryptocurrency and Forex trading, and seek advice from an independent financial advisor. Since Any opinions, news, research, analyses, prices, or other information contained on this website is provided as general market commentary, and does not constitute investment advice. The Bibres will not accept liability for any loss or damage, including without limitation to, any loss of profit, which may arise directly or indirectly from use of or reliance on such information. All opinions expressed are owned by the respective writer and should never be considered as advice in any form.
A qualified professional should be consulted before making any financial decisions.
-------------------------------------------------------------------------------------------------------------------
GALAUSDT trade ideas

TRADE OF THE DAY | GALA Potential 5.6%TRADE OF THE DAY | GALA Potential 5.6%
| Targets On Chart
Failed to break long term trend line and confirmation of a break down on the RVD - there is also a break down in the local trend ALT's are bleeding at the moment any way so shorts in general are quite favourable.

#GALA/USDT - Long - Potential 6.19%Direction: Long
Market: Spot
Risk: 0.25% - 1%
#USDT_GALA
Exchange: BINANCE
Timeframe: 360
TP1: 0.02623
Entry: 0.02478
STOP: 0.02333
Entry Conditions:
| RVOI Trendbreak
| At Support
| Price Trendbreak
| Crossed 20 MA

Next possible targets if it keeps going upHere are the next key levels it GALA keeps going up. These are Ichimoku levels.
The price is trying to get above a daily trendline and the lagging span (chikou span) is trying to get above a kijun sen level.

GALA price is on the verge before a big increase The GALA price is probably tamping the "bottom" now.
If we look at the full trading history of GALAUSDT and apply Elliott Wave Analysis, we get the following:
(1) a sharp wave of growth occurred in early 2023 and brought the GALA price out of a prolonged downward trend.
(2) a protracted six-month correctional wave in the A-B-C format probably ended in June 2023
(3) the 3rd wave, which is considered to be the largest/longest, is probably just emerging.
The GALAUSD price has a tough upward path ahead.
$0.07 is a strong mirror level, above which a dense liquidity zone begins.
We currently assume that the GALAUSDT price will be able to rise to $0.11-0.13 in a few months (x5-x6 from the current price). However, depending on the growth pattern, pace, and other inputs, the targets from above may be recalculated. In this case, we will update the GALAUSDT idea.
So, please like, comment, and subscribe if you are interested, and we will provide you with relevant thoughts)
_____________________
Did you like our analysis? Leave a comment, like, and follow to get more


Map of GalausdtA five-wave C wave, in order for a flat pattern to appear in three large waves for the shaded area

GALAUSDT SHORTContinuing the downtrend on the 30-Minute timeframe, GALAUSDT is likely to make a new lower low. It looks ideal for a short pose.
Selling opportunity for constantly falling GALA coin
Entry : 0.2396
SL : 2438
TP : 2272
Good Luck!

#GALAUSDT #LQR #TOBTC #LaqiraProtocolThe price is below the resistance of EMA 200 and the Intermediate Channel and can fall to certain support zones Once confirmed and matched with Bitcoin levels you can open a trade this analysis is not a buy or sell offer.

GALA - CUP & HANDLEHello everyone, I have identified a Cup & Handle pattern here, and there is a possibility that this could be the beginning of a new bullish run for Gala. Please note that this is not financial advice.

GALA - Keylevels for next weekIf you wanna take a trade on GALA, maybe before that, you need to conisder this KeyLevels of support and resistance areas.
Careful with longs until on daily is still bearish / downtrend

✴️ Gala Games Very Strong (New High Within Weeks)We've already seen how everything is moving up, no surprise... We are seeing bullish momentum starting to build up across the market; This is only the beginning.
The truth is that you haven't seen nothing yet.
We haven't seen anything yet... This is truly the beginning of this bullish wave.
We will see the Altcoins grow for weeks, can even be months, so imagine the potential.
GALAUSDT produced a higher low in June '23 vs Dec. '22 while most of the Altcoins produced a lower low. This is a signal of strength.
On the daily timeframe, GALA is already trading above EMA10 and EMA21 with a strong/bullish RSI.
We have now doubt that there will be more, higher highs follow higher lows.
That is all for now.
Thank you for your requests.
Thanks a lot for your continued support.
Namaste.

GALA-USDTHi guys, I think Gala will reach $0.0238 and $0.0228. And I want to buy it at this price, what do you think, is it a good idea? please comment and don't forget to like.

#GALA/USDT - Long - Potential 7.08%Direction: Long
Market: Spot
Risk: 0.25% - 1%
#USDT_GALA
Exchange: BINANCE
Timeframe: 360
TP1: 0.02527
Entry: 0.02362
STOP: 0.02197
Entry Conditions:
| Trendline Break
| Bullish Volume
| RVI Trend & Resistance break
Risky with BTC dominance spiking so be careful. I'm chancing it as it has already moved positively against the ALT market liquidity drop.

galaIt is in an upward trend in the 4-hour timeframe. In the lower timeframe, it is in a correction mode and is now reacting to the midline of the channel. Red lines are available

$GALAThe return of Web 3 games could be coming.
Potential 3X rally for INDEX:GALA
About to break out from RSI resistance trendline
Bollinger band oversold at D1
Potential butterfly harmonic pattern


GALAUSDTThere is an overbought RSI as well as a strong resistance where I expect the price to decline. This deal has a high win rate.


🔥 GALA Losing Support: Trigger Ready!GALA has been consolidating around the purple support for almost a week now. As it looks now, the price is eager to go lower and make new lows.
I'm patiently waiting for the price to make new lows. If we can close the candle below it, the expectation is that the bear trend will continue in the near term.
Stop above the most recent lower-high, target at 0.022

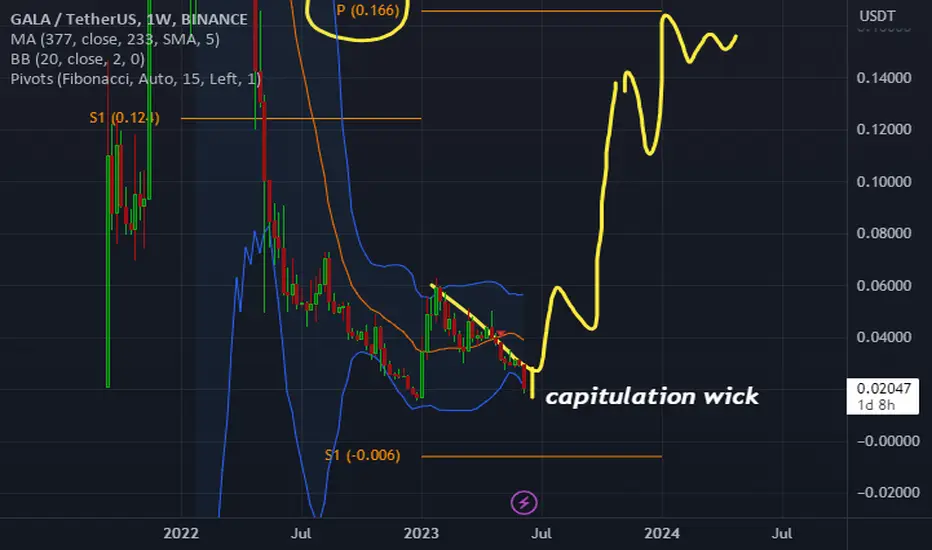
Gala deep fill, possible target 16.6cCurrent drop of Gala to 1.8 support shook a lot of people. Maybe some will never buy again.
I myself am seeing this flush as a good thing, as now the price is lower and the possible rises would be even more welcomed from lower.
I believe its possible here to start a move to 16.6 cents pivot for the long term, right now we are in an extremely oversold area and I am looking for the trade of the century, before the others sniff it out.
Good luck everyone and bears, keep shorting maybe you will win! But that reward long seems too good to miss - 2 cents to 16 cents massive potential.
GALAUSDT is testing the dynamic supportGALAUSDT is at a critical juncture as it tests the dynamic support level.
Dynamic support refers to a technical analysis concept where a moving average or trendline acts as a support level for the price. In this case, the dynamic support level is being tested by the GALAUSDT price, indicating a potential shift in the market sentiment.
If the price of GALAUSDT fails to hold above the dynamic support level, it would trigger a signal based on Plancton's rules. Plancton is a renowned trading strategy or system that follows specific guidelines for entering and exiting trades.
According to Plancton's rules, a breach of the dynamic support level would suggest a bearish trend reversal or a potential decline in price. Consequently, this would prompt traders following Plancton's strategy to consider initiating a new short position on GALAUSDT.
By going short, traders aim to profit from a downward price movement. They would sell GALAUSDT with the expectation of buying it back at a lower price in the future, thus capitalizing on the price decline.
–––––
Follow the Shrimp 🦐
Keep in mind.
🟣 Purple structure -> Monthly structure.
🔴 Red structure -> Weekly structure.
🔵 Blue structure -> Daily structure.
🟡 Yellow structure -> 4h structure.
⚫️ Black structure -> <= 1h structure.
Follow the Shrimp 🦐

Buy Time in GALAHello Traders!
Welcome back to another trade with analyst Aadil1000x.
Today we are going to BUY gala from this bottom as the market is now bullish.
GALA Buy Now @ 0.02572
Stoploss 0.02503(-2.64%)
Target 1, 0.02647(+2.9%)
Final Target 0.02724(+5.87%)
Don't forget to hit the like button and follow to stay connected.
