$GALA - 10x Potential After Retest
BINANCE:GALAUSDT has been lacking this cycle (most META coins have), but there’s potential for a 10x move here.
The chart is coming off a solid retest of the impulse move from September 2023. I'm grabbing as much as I can below $0.04 and targeting $0.60 if this cycle has the strength to push that high.
First target: $0.20
All timeframes are confirmed with reversal signals.
GALAUSDT trade ideas

#GALA/USDT Ready to go higher#GALA
The price is moving in a descending channel on a 15-minute frame and sticking to it well
We have a bounce from the lower limit of the descending channel, this support is at 0.05630
We have a downtrend on the RSI indicator that is about to be broken, which supports the rise
We have a trend to stabilize above the moving average 100
Entry price 0.06035
First target 0.06278
Second target 0.06516
Third target 0.06788

HODL GALA HODL GALA FOR ALT SEASON Q1 2025
1. CrowdSwap predicts that the price of GALA will be around $0.2989 by 2025, indicating a significant increase from its current price.
2. CoinCulture estimates a more conservative value of approximately $0.1739 by 2025, but still suggests potential growth.
3. Blockchain Reporter forecasts a range between $0.073 and $0.088 for 2025, which, while lower, still indicates a positive trend.
4. Changelly provides a prediction of $0.1364 by 2025, suggesting a steady increase.
5. Flitpay offers a more optimistic outlook with a maximum price of $0.93 by 2025.

Gala Games Long-Term Support Activated (Easy 255% - 342% BU-Pot)This simple chart right here reveals a pretty strong dynamic; We have a repeating pattern, the falling wedge; as well as the activation of a long-term support level... Join me in this analysis.
A classic correction produced a falling wedge in mid-2023 (left side of the chart). A 600% bullish wave develops once the correction hits strong support.
This year, another strong correction but this time much faster than last year, with early signals pointing at a reversal right at the same strong long-term support.
The last bullish wave produced 600% growth coming out of bear-market. This time we have a higher low, a signal of strength, and the new bullish wave coming out of a recovery year; this means that this wave can be many times stronger than the previous one. Instead of 600%, we can see 700%, 800% or more. On the short-term, it can be smaller, but the complete wave should be something off-this-chart.
➢ Prepare for massive growth. First short-term, and then again in 2025, with a major bull-run that will end in a new all-time high.
Namaste.

Gala Breaks Critical Resistance, Targets in Sight!Hello ,
Gala brokeout Above $0.027 Resistance, First Target Set at $0.048
bye,

GALAUSDT - preparing for the biggest moveOne of the most importanr coins in gaming sector... with a strong promising project
weekly chart display
- rise of 170% after breakout the falling wedge
- succefull breakout , retest of the major trendline
targets:
1- 0.16 (200%)
2- (0.87) (1300%)
Best regards Ceciliones🎯

Gala/UsdtBINANCE:GALAUSDT
INDEX:GALA / USDT - Weekly breakout candle in preparation!
Growth potential is INSANE! 🚀
Prices could fly toward $0.1050 - $0.1100 🛫, which corresponds to the trend resistance! (W)
⚠️ Key support that will probably be retested to confirm the breakout: $0.0500 - $0.0520 📉 (I'll set buy orders around that zone)!! I prefer to not FOMO on a full green candle. 🐸
You know, patience = profits 💰 🐸 (not financial advice).
Not Financial advice

GALA swing optionGALA has formed bullish structure on 1d chart and looks like it could break out of a flag it's forming on 4h. If BTC remains bullish, GALA price could push up towards the FVG above.
On a macro timeframe GALA appears to be in this ascending channel.
Possible for a swing long especially if there is a pullback.

$GALA is heading for TP3!🚀 * INDEX:GALA is heading for TP3!*
• Already **232% profit** secured and the momentum is still strong! 📈🔥
• Eyes on the next target—big moves ahead!

#GALA/USDT Ready to go higher#GALA
The price is moving in a descending channel on the 30-minute frame and sticking to it well
We have a bounce from the lower limit of the descending channel, this support is at 0.04650
We have a downtrend on the RSI indicator that is about to be broken, which supports the rise
We have a trend to stabilize above the moving average 100
Entry price 0.04814
First target 005097
Second target 0.05316
Third target 0.005573

#GALA (SPOT) entry range(,01780 -,02380) T.(,04450) SL(,01648)BINANCE:GALAUSDT
entry range (0.01780 - 0.02380)
Target1 (0.03200) - Target2 (0.04450)
2 Extra Targets(optional) in chart, if you like to continue in the trade with making stoploss very high.
SL .1D close below (0.01648)
*** collect the coin slowly in the entry range ***
*** No FOMO - No Rush , it is a long journey ***
**** #Manta ,#OMNI, #DYM, #AI, #IO, #XAI , #ACE #NFP #RAD #WLD #ORDI #BLUR #SUI #Voxel #AEVO #VITE #APE #RDNT #FLUX #NMR #VANRY #TRB #HBAR #DGB #XEC #ERN #ALT #IO #ACA #HIVE #ASTR #ARDR #PIXEL #LTO #AERGO #SCRT #ATA #HOOK #FLOW #KSM #HFT #MINA #DATA #SC #JOE #RDNT #IQ #CFX #BICO #CTSI #KMD #FXS #DEGO #FORTH # AST #PORTAL #CYBER #CLV #RIF
ENJ #ZIL #APT #GALA ****

#GALA/USDT Ready to go higher#GALA
The price is moving in a descending channel on the 30-rather frame and sticking to it well
We have a bounce from the lower limit of the descending channel, this support is at 0.04080
We have a downtrend on the RSI indicator that is about to be broken, which supports the rise
We have a trend to stabilize above the 100 moving average
Entry price 0.04240
First target 0.04395
Second target 0.04707
Third target 0.04974

$GALAUSDT 2x trading ideavery promising chart and i see easy 2x gains. entry and exits are on the chart. It will reach red line in a month or so.
prices are on the chart.

Gala Games: The Strongest Bull-Market In The History Of Crypto This will be the biggest bull-market ever... Are you ready? This is it!
This is great because we are early now, we are conscious now, we are ready now and our strategy has been in the making long-term.
We have the tools. We have the right mindset, we are ready for success and growth.
The Cryptocurrency market is the market for the people... Are you ready?
Time is running out... Make your move now and next year you will be happy with the results.
➖ GALAUSDT (Gala Games)
I am using the linear chart here just to show that it is still early, super early.
GALAUSDT will complete this week a streak of four weeks closing green, but it is still trading at bottom prices. There is plenty of room left available for prices to move higher.
Plenty of room available for growth but once it starts moving, it will never look back, so it is better to get in now and let the market take care of the rest.
As long as you are Crypto (Altcoins), you win. Plain and simple.
This is a friendly reminder focused on timing.
I would like to thank you once more for your continued support.
Let's trade.
Together we can win.
We have the charts, the numbers and the knowledge; a little bit of planning and we can buy the bottom and sell at the top.
There is no need to catch the exact bottom; there is no need to catch the exact top.
We just need to buy low and sell high:
➖ Buy when prices are low, when the market is like it is today.
➖ Sell when prices are high, next year after a strong bullish wave.
The time to buy is now. It will be easy to identify the time to sell.
The chart will be up. Everything will be up. And people will be going crazy. That's the signal.
Thanks again for your support.
Namaste.

Gala/UsdtBINANCE:GALAUSDT
INDEX:GALA Possible setup:
Lower entry recommended for long position! ⚠️
No worry if we miss it, there will be plenty of others opportunities!
Disclaimer:It's not financial advice ....

GALA - Pump During Gaussian Bear PhasePrice is experiencing a bear channel on the Gaussian channel, however this is the best time to pump.
GALA will follow all altcoins during this alt bull pump cycle.
Horizontal Support is Evident.

#GALA #USDT Short Set UpOn 1H TF looks like it will continue downtrend. Took short at current price.
Entry 0.03331
Stoploss 0.03769
TP-1 0.02927
Tp-2 0.02589

"GALA Ignites the Bulls: A Daily Surge Unfolds"From the point marked with the red arrow on the chart, we observe the beginning of what appears to be a developing pattern in GALA. The structure suggests the formation of a diametric, a rare and complex pattern, and the price is currently advancing toward completing the E wave within this structure.
As long as GALA stays within the boundaries of the green range highlighted on the chart, the potential targets shown remain in play. Each target is clearly defined, and price movement towards these points is anticipated, as outlined in the image.
However, if the price closes a daily candle beneath the specified invalidation level, this would invalidate the current analysis, signaling that the diametric pattern may no longer be in effect.
To manage risk effectively, it’s essential to employ sound capital management strategies. Set your stop loss appropriately and be mindful of your exposure. As we approach the first target, it’s wise to lock in some profits. At this point, adjust your stop loss to the entry price to secure gains and minimize potential losses.
Feel free to ask any questions in the comments if something is unclear or if you'd like further clarification.
Thank you for your time and attention, and as always, trade wisely!"

#GALA/USDT Ready to go up#GALA
The price is moving in a descending channel on the 30-minute frame and sticking to it well
We have a bounce from the lower limit of the descending channel, this support is at 0.03300
We have a downtrend on the RSI indicator that is about to be broken, which supports the rise
We have a trend to stabilize above the moving average 100
Entry price 0.03400
First target 0.03566
Second target 0.03780
Third target 0.04040

GALA is bullish (1D)From where we placed the red arrow on the chart, it seems that the GALA pattern has started.
The pattern seems to be a diametric, now it looks like GALA is going to complete the E wave of this diametric.
It can go to the targets on the picture while maintaining the green range.
The targets are listed on the chart.
Closing a daily candle below the invalidation level will violate the analysis.
For risk management, please don't forget stop loss and capital management
When we reach the first target, save some profit and then change the stop to entry
Comment if you have any questions
Thank You

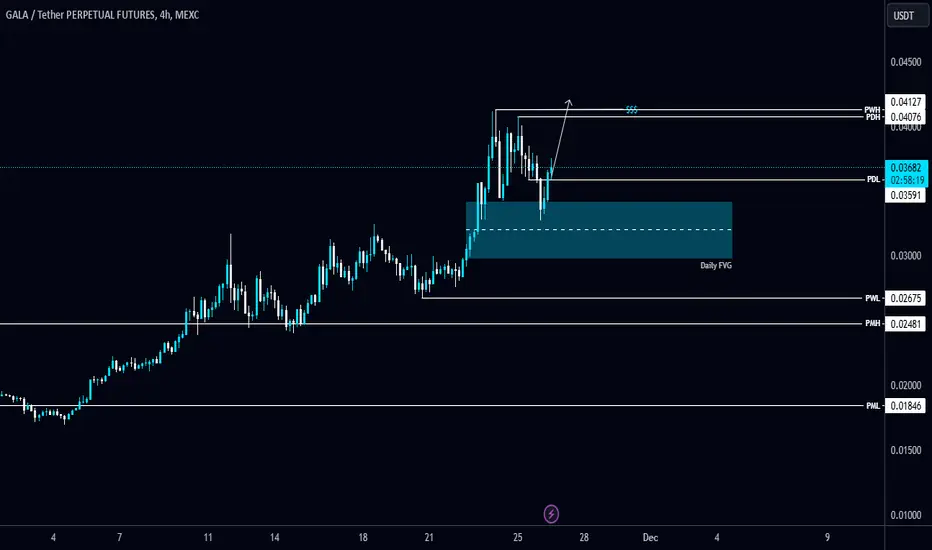
#GALA/USDT tapped the daily FVG and bounced hard.#GALA/USDT tapped the daily FVG and bounced hard.
Expecting a buy-side liquidity to be taken. The local resistance level is PWH $0.02127 and the support level is PMH $0.02481.
GALA short updatewell you see if it keeps respecting this trend line from the 6 hr timeframe it can go up to the 1.618 which you see the target but that will take a few days maybe but it is a good time now to go long and then take again profit around that level we had before. Cause you see it did build some higher lows there and should go up even more and if you hold longer and move your stop loss accordingly you can ride maybe till this 1.618. If you see the trendline break get out of the trade and take your profits. Hope this helps.

GALA TRADE ENTRIESGALAUSDT is doing nice moves and it has given 15% from to me from last chart. Now i will look for another Long position in it below the SSL in FVG. It has done MSS as mentioned on the chart. Entry will be from FVG zone and if price comes down then I will do DCA at marked Dca zone.
