galausdt predicationsHello traders,
I have found a gem of a scam coin for my crypto followers. When zi bull run gets going for altcoins, this monster will fly to the moon.
For now let's target the 0.61% retracement and see where that takes us.
Goodluck!
GALAUST trade ideas

GALA Bullish to the Moon 🌙 GALA breakout of trendline
Breakout of residence
Breakout of Volume
After retest will see you on the Moon

Buy signalA great scalp position, given that we are in a strong uptrend and corrective wave analysis we can expect to return to the green zone.
Be patient and enjoy your profit


GALAUSDT 1WI'm bullish on #GALA again. The price is challenging the Horizontal line + Ichimoku cloud and Descending line on weekly chart, which is big timeframe. It is already broke the MA50 and moving above it. That is bullish sign for me. My targets are:
$0.03974
$0.04801
$0.05629
$0.06808
$0.08309

GALA 🔥 #Head&Shoulder #sell Based on the formation of a head and shoulders pattern, it seems probable that Gala will experience a decline in value. As a result, I intend to initiate a short position on this asset, as it appears increasingly likely that a downward movement will occur in the near future.

Gala head & shoulder pattern ?The 1-hour time frame is indicating weakness, with the formation of a head and shoulders pattern. This pattern is typically considered a bearish sign according to textbook analysis. Therefore, I have decided to take a short position.

Elliott Wave on GALAUSDT! A Clear Roadmap for every trader...Greetings trader and investors around the globe
The GALAUSDT price chart indicates a five-wave rally from August to November 2021, followed by a 98.53% crash in approximately 700 trading days.
Since the October 2023 low, there's been a five-wave rally and a three-wave decline, suggesting a potential end to the decline. A break above 0.3505 could confirm this and indicate an upcoming upward trend.
If correct, a significant price increase may occur, with a minimum target around 1.097, aligning with wave A equality at C .
If you find this analysis helpful, please don't forget to like, comment and hit the follow up button, till I come you way next time, trade safe and may the market be with you.

🚨#GALA/USDT Long#GALA
The price is moving in a descending channel on the 12-hour frame
Now it is about to break that channel upward after testing the downtrend of the channel
We have buying momentum on the MACD indicator
Entry price is 0.02287
The first target is 0.02424
The second goal is 0.02689
The third goal is 0.02965

Gala/usdtINDEX:GALA forming a bullish inverse head and shoulder pattern in a 4h timeframe. If it successfully breaks and maintains above $0.028 then we see the expected target of $0.036.
DYOR

Breakout - Target: 0.05$1. Supertrend positiv
2. positiv accumulation
3. positiv squeeze
Targets marked with yellow dotted lines in chart

GALA Growth Spurt: Buy Your Ticket to Profit!"## GALA Coin: Short Fundamentals, Recent News, and Disclaimer
**Fundamentals:**
* **Utility token for Gala Games:** GALA is the primary token within the Gala Games ecosystem, a blockchain-based gaming platform.
* **Used for various purposes:**
* Purchasing NFTs within Gala Games
* Rewards for operating Founder's Nodes
* Network fees on the Gala blockchain (currently in development)
* **Total supply:** 35 billion GALA, with a circulating supply of approximately 6.9 billion.
* **Current price:** $0.027 (as of February 21, 2024)
* **Market cap:** $188 million
**Recent News:**
* **Gala Games launched several new games in beta:** Town Star, Mirandus, and Echoes of Empire are attracting players and generating NFT sales.
* **Gala introduced GalaChain:** A dedicated blockchain for Gala Games is under development, expected to launch in 2024.
* **Partnerships with various gaming companies:** Expanding the reach and potential user base.
**Disclaimer:**
* This information is for informational purposes only and should not be considered financial advice.
* The cryptocurrency market is volatile and past performance is not indicative of future results.
* Do your own research before making any investment decisions.
**Additional notes:**
* GALA's price has been relatively stable in recent months, after experiencing significant volatility in early 2023.
* The upcoming launch of GalaChain could be a major catalyst for the token's price.
* However, the success of Gala Games and its token ultimately depends on the adoption and popularity of its games.
I hope this provides a helpful overview of GALA Coin. Remember, conducting your own research and understanding the risks involved are crucial before making any investment decisions.

GALA is pressing for a break. 0.06 next?Like most Altcoins, BINANCE:GALAUSDT also broke above a falling wedge's resistance in Oct-Nov of last year.
It experienced an initial leg up, followed by roughly a 300% increase, and then underwent a normal correction afterward.
The price halted its decline from the recent high at the 61% Fibonacci level and has begun to rise again, possibly indicating the end of the correction phase.
Currently, the price is encountering local resistance, and in the event of a breakout, we can anticipate continuation.
This rise could lead to an increase to around 0.06, a crucial resistance level.
Despite my reservations about the project's tokenomics, I am technically bullish and will allocate a very small portion of my portfolio to this trade.

Buy and hold GALA/USD from this ZONEIf you missed the start, here is the BULLISH version. This is how it should continue. It will also be difficult here under this red line course, so I wouldn't rule anything out here at the moment. Act wisely, not with too much RISK and always keep yourself informed. Don't watch too much TV and news, the only interest here is to guide you to where you make wrong decisions. Just follow a thought that you are 100% convinced of, then you will earn money in the long term without RISK.

Gala/usdt buy ?I expect that the gala token will move in the direction as seen. what are your thoughts on this

Volume Profile and Trend-Based Fibonacci Extension AnalysisVolume Profile and Trend-Based Fibonacci Extension Analysis
Summary:
This trade proposal utilizes Volume Profile analysis combined with Trend-Based Fibonacci Extension to identify potential trading opportunities. By examining volume distribution and key Fibonacci extension levels, we aim to pinpoint potential areas of interest for entering or exiting trades.
Technical Analysis:
Volume Profile Analysis: Utilizing Volume Profile analysis, we can identify significant price levels based on the volume traded at each price level. This allows us to discern areas of high and low liquidity, which can provide valuable insights into potential support and resistance zones.
Trend-Based Fibonacci Extension: Applying Fibonacci Extension levels to the prevailing trend allows us to project potential price targets beyond the initial impulse move. By anchoring the Fibonacci levels to key swing points in the trend, we can identify potential areas where price may encounter resistance or support as it extends in the direction of the trend.
Interpretation:
By combining Volume Profile analysis with Trend-Based Fibonacci Extension, we can identify confluence zones where both techniques suggest potential areas of interest. These confluence zones may serve as strong levels of support or resistance, providing favorable entry or exit points for trades.
Trade Plan:
Entry: Look for opportunities to enter trades near confluence zones where Volume Profile levels align with Fibonacci Extension levels. This could involve entering long positions near confluence zones acting as support or short positions near confluence zones acting as resistance.
Stop-Loss: Place stop-loss orders below support levels in long trades and above resistance levels in short trades to manage risk effectively.
Take-Profit Target: Set take-profit targets based on the projected extension levels provided by the Fibonacci Extension tool. Additionally, consider taking partial profits at key Fibonacci levels or when price encounters significant volume nodes.
Risk Management:
Implement proper risk management techniques by sizing positions appropriately and adhering to predetermined risk-reward ratios. Monitor trades closely and be prepared to adjust positions as market conditions evolve.
Disclaimer:
Trading involves inherent risks, and there is no guarantee of profits. Conduct thorough analysis and consider all factors before executing trades. Utilize stop-loss orders and risk management strategies to mitigate potential losses.

Double Bottom? HmmmmKeep an eye on this baby...we could see one more retest
on the RSI trendline before heading to the moon. Set some
limit orders down around the line just for the fun of it...you
never know...if BIG DADDY BTC decides to retest 44k...I could
see this double bottom play out. Good luck and see ya on the
GALA MOOOOOOOOOOON trip baby!

GALA SCALP SHORT SIGNAL 15 MINHello dear traders
There is a scalp trading position in Gala currency
I will put the position in the chart for you
This position is high risk and you must do capital management
Thank you for your kindness to me

GALAUSDT longsIf BTC sees a run up to previous high of 690000 could potentially see gala hit 0.80 cents ath and above. Web3 Gaming market is dormant and tends to rise with a lag after BTC makes its move.

GALA/USDT | 1W 👀GALA is the utility token of the Gala Games platform. It serves as an incentive for node operators, network management, in-game rewards, and gaming assets, as well as for buying and selling NFTs in the Gala Games store.
Undoubtedly, this represents the future, as the company is rapidly expanding, which has certainly impacted the price of the INDEX:GALA token.
- Not financial advice, trade with caution.
✅ Stay updated on market news and developments that may influence the price of GalaGames. Positive or negative news can significantly impact the cryptocurrency's value.
✅ Exercise patience and discipline when executing your trading plan. Avoid making impulsive decisions driven by emotions, and adhere to your strategy even during periods of market volatility.
✅ Remember that trading always involves risk, and there are no guarantees of profit. Conduct thorough research, analyze market conditions, and be prepared for various scenarios. Trade only with funds you can afford to lose and avoid excessive risk-taking.
#Crypto #GalaGames #Investment #GALA

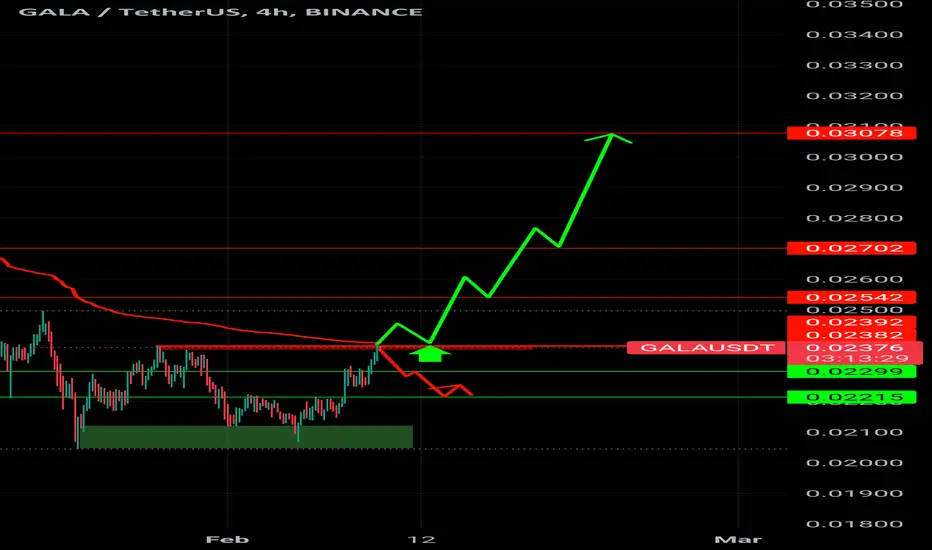
GALA Two Scenarios GALA Two Scenarios.
If 4h candle will close red then I will Enter Short.
If Preice break up resistance and retest then I will Enter Long
⚖️💹 GALA Trading Strategy 🌐📊📊 Current Market Status:
GALA consolidating within a support area between $0.02050 and $0.02200.
🔄 Trading Strategy:
Laddering Into Long Spot Trade: Initiating a long spot trade with a ladder approach.
Take-Profit Areas: Approximately $0.028 and $0.035.
Stop-Loss: Set just below $0.02.
📣 Market Insight:
Belief in the gaming sector's potential rally.
GALA may move quickly if the gaming sector experiences a strong run.
📈💡 #GALA #TradingStrategy #CryptoMarket 🌐📊

GALA inteligentassetbullish scenario
resistances 0.022, 0.0246 in 50 ema, 0.0253 in 200 ema, 0.0265 W pattern target
bearish scenario
supports 0.02 pivot low,0.0192 lower limit of channel, 0.018
