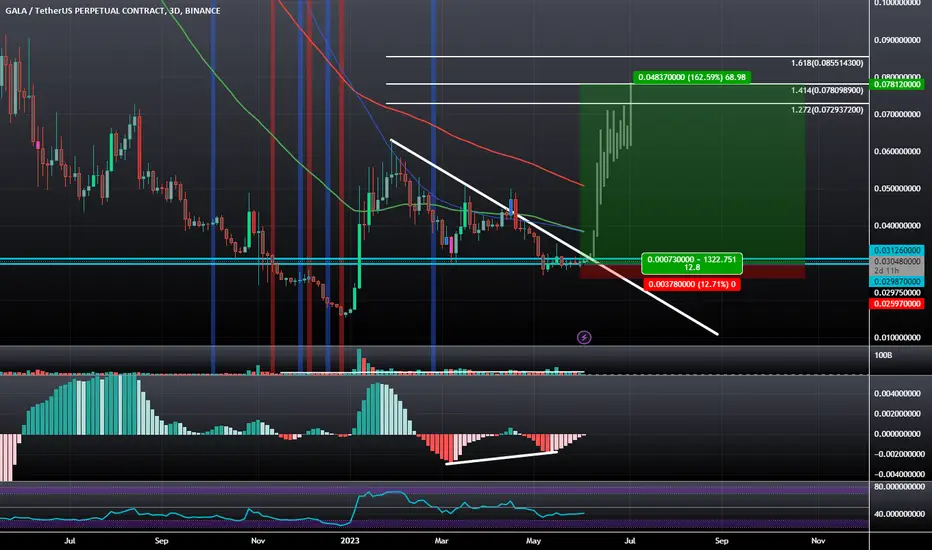
GALA Games: Potential AB=CD BAMM Bullishly Diverging at SupportGALA looks like it could be setting up for a double bottom at a local support it's created for itself. During this process it's formed some Bullish Divergence and has given us a potential Bullish Dragon Trend line; if it breaks out I would think this would be the start of an AB=CD movement up to the 1.414 Extension of 7.8 cents
GALAUST trade ideas
GALA📊 #GALAUSDT
⏱ TIME: 1D
📝It is reaching very important areas for spot purchases, and you can make purchases in a gradual and managed manner. It has also been checked for fundamental analysis and is a sustainable and strong project for the future.
📍The initial buying limit: 0.024 $
📌TP1: 0.04 $
📌TP2: 0.06 $
📌TP3: 0.145 $
📌TP4: 0.4 $

Rising from the Ashes: GALA V2 Ignites a Spectacular GALA Run GALA V2: Igniting a Thrilling Bull Market Breakout, Surging
GALA, the blockchain and gaming juggernaut, defies expectations with an explosive breakout synced with the highly anticipated bull market. The migration to GALA V2 and a jaw-dropping burn of 21 billion shares set the stage for an electrifying ascent.
Within an ascending parallel channel, GALA captures the attention of investors with an unwavering climb. Riding the bullish wave, GALA holds its position, delivering mind-boggling returns exceeding 5 times the initial investment.
This breakout, perfectly aligned with the bull market, shakes the cryptocurrency world. GALA emerges as an unrivaled force, reshaping success in blockchain and gaming. Partnerships flourish, users multiply, and investors rush to join this meteoric rise.
Hold on tight as GALA skyrockets, defying expectations and setting new benchmarks. The fusion of GALA's breakout and the bull market is an adrenaline-fueled spectacle, where dreams turn to reality and investors witness unprecedented returns. Get ready to be part of this thrilling journey!

GALA longGALA bounced off the support level. Asset broke through the descending trendline. Bullish movement to resistance level at 0.346 is expected to happen.

Short in GALAHello Traders!
Welcome back to another trade with analyst Aadil1000x.
Today we are going to sell gala from this position as this pattern will reverse the GALA.
Gala short now @ 0.3165
Target 1, 0.03075(+2.87%)
Final Target 0.02981(+5.84%)
Stoploss 0.03239(-2.34%)
Don't forget to hit the like button and follow to stay connected.

#GALAUSDT #LQR #TOBTC #LaqiraProtocol● Specific support and numbers on the chart can each have a scalpe trade
• Specified levels are obtained from the intersection of static and fibro levels
• Please enter the transaction after confirmation
• This analysis is not an offer to buy or sell
GalaUsdt ShortThis pair has bounced of the trendline and has started losing momentum, general market sentiment is also not helping as it is risk of. look to short the pair where possible.

Mixed Signals in Current Market ConditionsGALA is currently trading at a price of 0.02997, which doesn't provide immediate insights on its market trajectory. However, when combined with other indicators, a clearer picture emerges.
The Relative Strength Index (RSI) stands at 42, indicating a neutral market sentiment with balanced buying and selling pressure. This suggests that GALA is neither overbought nor oversold, portraying a market that is currently in equilibrium.
Examining the Fibonacci retracement levels within the 4-hour timeframe, we find potential resistance levels. The 0 Fibonacci level at 0.03055 serves as immediate resistance, and a significant volume-driven breakout above this level may signal bullish momentum. Furthermore, the 0.5 Fibonacci level at 0.03292 represents a crucial point to monitor. If GALA manages to surpass this level convincingly, it could indicate a stronger bullish sentiment and a higher likelihood of further price appreciation. Finally, the 1 Fibonacci level at 0.03529 acts as the highest Fibonacci level in the timeframe. A decisive breakthrough above this level would indicate a robust bullish trend, potentially leading to significant price gains.
The volume oscillator currently stands at -17%, reflecting a decrease in volume compared to previous periods. This suggests diminished market participation and reduced conviction in price movements. It is important to consider volume trends in conjunction with other indicators to gain a comprehensive understanding of GALA's market dynamics.
Additionally, the Moving Average Convergence Divergence (MACD) has a negative value of -0.00042, implying a short-term bearish bias. While this indicates downward momentum, it is essential to interpret it in the context of other indicators for a more accurate assessment.
In summary, based on the information provided, GALA exhibits a neutral RSI, potential resistance at Fibonacci levels, decreased market participation indicated by the volume oscillator, and a short-term bearish bias according to the MACD. To formulate a more comprehensive analysis, it is advisable to consider additional factors such as market trends, news developments, and fundamental analysis.

gala/usdt long💎GALA/USDT
🟢long
🛑max lev 50
💵$2%-1%
🟩enter:0.03
🟥stop :0.02967
🔮target's
🪙0.03033
💶0.03066
💷0.03132
💴0.03198
💵0.03396
R/R = 12
RISK low

GALAUSDT 4H Crypti GALAGood time, I have depicted the situations on the page. And I don't think it needs further explanation. Thank you for liking.

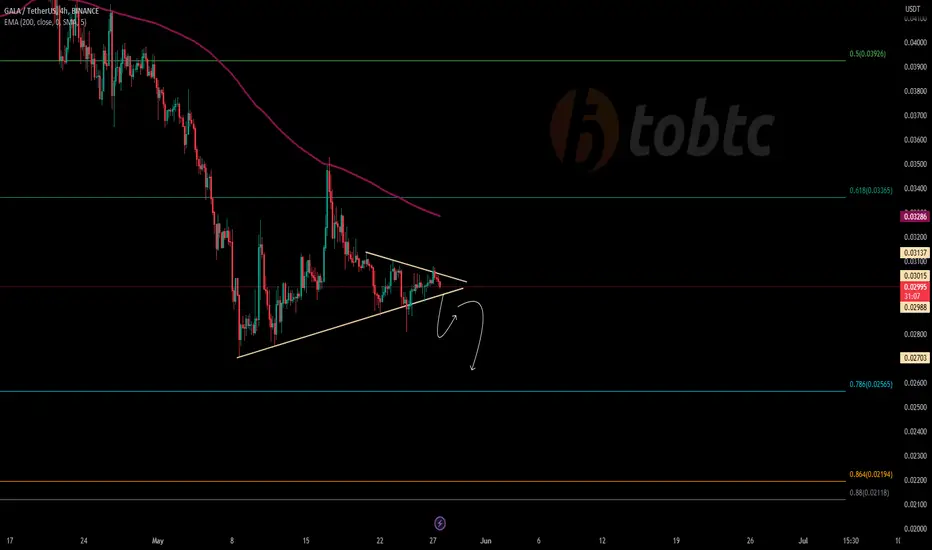
GALAUSD LONG POSITION. On the chart we can see a symmetrical triangle pattern.
Our strategy is to open a long position when the price breaks above the upper resistance.
Target is shown on the chart.
Invalidation of this thesis would be if the price breaks below the upsloping support line.

GALAUSDT is ready?GALAUSDT has grabbed new liquidity from the 0.786 Fibonacci level, indicating a significant level of buying interest in the market.
According to Plancton's rules, this liquidity grab from the 0.786 Fibonacci level could potentially suggest a bullish trend reversal or a continuation of the existing upward momentum. Traders following Plancton's principles might consider waiting for a breakout above a key resistance level before considering a new long position.
A breakout occurs when the price successfully surpasses a significant resistance level, indicating a potential shift in market sentiment and a possible continuation of the upward trend. By waiting for this breakout confirmation, traders can increase the probability of a successful long trade.
Once a valid breakout above the resistance level is confirmed, traders following Plancton's rules may consider opening a new long position, expecting the price to continue its upward movement.
–––––
Follow the Shrimp 🦐
Keep in mind.
🟣 Purple structure -> Monthly structure.
🔴 Red structure -> Weekly structure.
🔵 Blue structure -> Daily structure.
🟡 Yellow structure -> 4h structure.
⚫️ Black structure -> <= 1h structure.
Follow the Shrimp 🦐

GALAUSDT.P Selling movement weak.
all levels are as per market behavior and as per fib
market is on consolidation
these all levels are strictly my view.. please don't make any trade without your financial advisor.

galaThe intended correction was not done to move up. It started moving directly. I am waiting for a support in the green lines for the higher red lines.

GALAUSDT.P 1 Hour as per RSI and CCI behavior, indication for short.
Market phycology is neutral.
my phycology is also neutral.
short at .02994 and long at .03071

GALA/USDTGALA/USDT
The currency has a negative sign and is not valid for entry, targeting 0.022
I know people who spoke to me from the most famous people entering from 0.055 and we told them to sell at 0.043 because it will not return to this price
Then I tell you, we will see you at 0.022 🌺👌🏻
@HsaNCharT

GALA/USDT Good buying opportunity ??Buy region for Gala between .015 to .030
Sell above .056 and .73 region to get double profit

Morning star!Given the Morning star candlestick pattern as well as the very strong resistance and the 0.236 fib, there is probably room for upside, just wait and enter the market at the right time...

GALA longGALA bounced off the lower boundary of horizontal channel. Bullish movement to resistance level at 0.0315 is possible.

🔥 GALA Bearish Channel: More Pain Before ReversalIn my most recent GALA analysis I talked about the fact that GALA lost the immediate uptrend and that more pain was coming. Congratulations if you took the trade, both targets hit!
For now, I think it's likely that we're going to make a new low. My ideal reversal point would be the bottom support of the bearish channel.
Not expecting that we're going all the way back towards the top of the channel, so want to keep my targets close. See blue dotted lines at 0.028 and 0.033

🔥 GALA Uptrend Lost: Bearish Correction AheadGALA has failed to make a bounce from the dotted resistance, and has fallen through it.
In my eyes, GALA will fall further. I'm looking at the blue lines as my initial targets.

Gala Big Correction and Big BoomI have plotted the fibonacci from the bottom to the recent top, expecting the price to find support at the 236 if we begin the correction/collapse as it is indicating currently.
I will be looking for longs if I see good defence on the 236 near 2.5c if we do get any significant dips at all

