GAS/BTC price analysis by CryptoBullSignals GAS/BTC heading towards the upside, I see the only upside.
Already in an oversold position.
GASBTC trade ideas


#GAS BTC ( Long Term ) For long-term investments we expect an increase in the coming months
Stop loss : 0.0001390 satoshi
Don't forget about risk management

GASBTCGASBTC
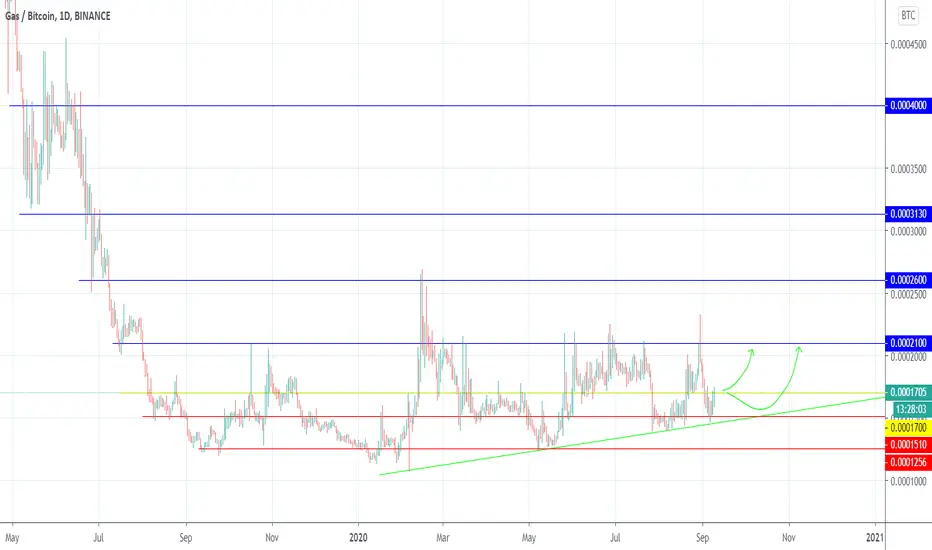
Purchase in the area of 0.00017 - 0.000151
1 - 0.000210
2 - 0.000260
3 - 0.000313
4 - 0.000400
Fixation below the green trend line, the price may turn into accumulation
f you like what I do, put 👍 and subscribe
Waiting for your comment, what do you think about this?
GAS/BTC - a map for the futureGAS/BTC - a map for the future
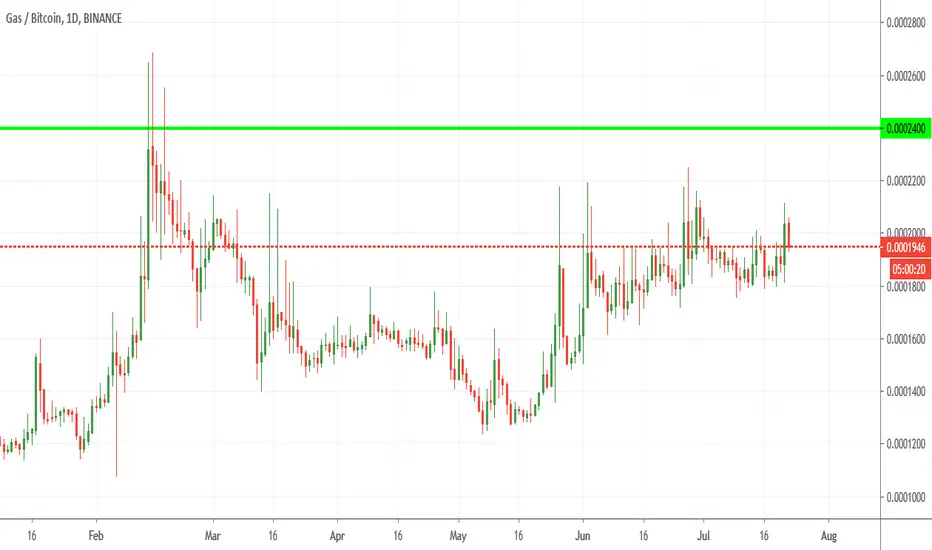
Gas retraced more than 98% against BTC, which is quite a lot, and started what seems an accumulation phase after 11th September 2019
The green line will be a strong support, and the first RED line will be a possible Target at 2777.
If it will b able to close a weekly candle above it, the other long term goals could be 4440.
Lastly, if it would be able to close a weekly candle above 4440, it could aim to 6111
As you can see 4440 and 6111 are less colored because are less probable.
The Pink dates could be a moment where the price tend to bounce up or slow any eventual fall.
In the short term, it is possible that the price could be rejected by the red eye.
LS MASTER TRADING SYSTEM


GASBTC | Accumulation about to breakGASBTC is attempting a breakout.
If broken out next resistance is 120% away.
Dont miss this one

GAS weekly - potential diamond bottomSimple and self-explanatory.
Potential diamond bottom formation for GAS vs BTC.
Supported by bullish weekly RSI div and Stoch RSI div.

GAS short-term update
- Ascending triangle developed to support bullish Chuvashov fork;
Hitting 1900-2000 sat area will further reinfornce the idea of diamond bottom on weekly.


GAS LONGGAS is usually following NEO , which is also starting new cycle. + GAS is in oversold area, I expect bull run very soon. GL !
btw this is not financial advice :)

GAS long entryComments on the chart, just to add that NEO breakout already occured, and GAS usually follows.
Good luck !


GAS/BTC is in a very large bullish triangle!GAS/BTC is in a very large bullish triangle!
Enter in the green zone for an aggressive entry before the breakout.
BTC needs to behave so alt/btc pairs don't get rekt.
This chart could change dramatically and become invalid if Bitcoin behaves irrationally.
Depending upon your risk tolerance, set stop below any one of the support lines.
Trade safe my friends....
BINANCE:GASBTC


GAS Breakout SetupBuy : 1900 - 1920
Stop : 1800
Target : 2100 , 2500 , 300 , 3500
price at trend line Support price close below trend line support is our stop loss but for fake breakdown we will set 5% stop 1800
price at trend line support and also right shoulder about to complete

GAS coin perfect Buying SetupNeed daily close above 1800 and we are ready to go
S/R flip really close 2000 sats close above 3000 is just walk by
Holding 200 EMA with kumo cloud support on daily perfectly
waiting for tomorrow close

Weekly higher low bounce off the MABull Market NEO and GAS have been quite. In America we don't hear much of these but the Bull is coming. MACD break trend on the Weekly. Candle bounce off of MA cross. I just dont see any different. 4k sat coming

GAS will be greatGas is one of most undervaluated lowcap shits. I have been filling bags at 1500. I dont sell it until it make 4500 sat


