Double bottomDivergency double bottom on the Dow. It's a intriguing one as its the only index giving us the buy signal. One should always follow the strategy, even if you don't believe its going to workout, as there's a great deal of randomness in this business.
DJ30 trade ideas

What could be comingThis is exactly what will happen until 2070... or not...
If the future will somehow resemble this projection, then several recessions and a few depressions are due moving forward. And then, sky rocketing mode again...

US30 Trading Plan – Bearish Outlook Following Support BreakThe US30 (Dow Jones Industrial Average) is currently exhibiting a bearish trend, having recently broken below a key support level. This breakdown signals potential further downside momentum, indicating a shift in market sentiment from bullish to bearish.
Technical Analysis Summary:
Trend: Bearish
Breakdown Confirmation: Price has closed below the previous support level, confirming a breakdown and potential trend continuation.
Entry Signal: Entry positions can be considered on a retest of the broken support level, now acting as resistance, or upon confirmation of continued selling pressure.
Profit Targets:
Target 1: The first profit target is set at the next significant support zone, which has historically acted as a demand area.
Target 2: The second profit target is located at a lower, more established support level, providing a deeper downside opportunity if bearish momentum persists.
Risk Management:
Stop-Loss: A stop-loss should be placed above the newly formed resistance level (formerly support) to protect against false breakouts and trend reversals.
Position Sizing: Risk no more than 1–2% of account equity per trade to maintain proper risk management.
Trade Rationale:
The breakdown of the support level on US30 suggests increased selling pressure and the potential for a continuation of the downward trend. By identifying two profit targets, this plan allows for partial profit-taking at the first support level and full exit or trailing stop at the second, depending on price action and market conditions.

DOW JONES Inverse Head and Shoulders starting new rally.Dow Jones/ US30 has found support today on its 1day MA50 despite the strong correction.
The long term pattern is an Inverse Head and Shoulders and today's 1day MA50 hold may complete its Right Shoulder.
Go long and target the 2.0 Fibonacci extension at 50000.
Follow us, like the idea and leave a comment below!!

WHY I THINK US30 WILL BUY INSTEAD OF SELL🔥 Bias: Bullish continuation
🕒 Timeframe: 60-minute
💎 Instrument: US30 (Dow Jones)
1️⃣ Volume Profile Context
POC (Fair Value): ~41,680
HVN (Acceptance): 41,660–41,700
LVN (Balance Break): 41,540–41,600
2️⃣ Footprint Signals
Seller Imbalances in the 13:00 & 14:00 candles (Δ–159 @ 9.13K & Δ–121 @ 7.97K)
– Price didn’t drop, closed near highs → Supply absorbed
Absorption above 41,700 shows hidden bid
3️⃣ Structure & Key Zones
Higher highs & higher lows intact since the 07:00–08:00 low.
Buy zone / demand: 41,400–41,500 (strong initiative buying & positive deltas)
Support to hold: 41,660–41,680 (POC / HVN)
▶️ Trade Plan
Entry: On pullback to 41,660–41,680 (POC support)
Stop: Below 41,640 (below LVN)
Target 1: 41,880 (previous high & volume shelf)
Target 2: 41,920+ (upper HVN rejection zone)
✅ Confirmation: Look for bullish footprint bars (positive delta, absorption of sellers) at entry zone.

Dow Jonas - Elliot wave📉 DJI — Elliott Wave Top in Sight?
🔍 A long-term analysis with serious implications...
I've been diving deep into the Dow Jones Industrial Average (DJI), using Elliott Wave principles — and what I see may signal the end of one of the longest bull markets in history.
Elliott was right — the massive bull cycle did arrive and extended well into the 2000s. But now, that journey looks to be nearing its final destination.
Currently, I believe we're witnessing the development of an Ending Diagonal pattern — a structure often seen at the end of a major impulse. This formation appears to be completing a set of blue sub-waves, which in turn cap off the larger green primary impulse wave.
📍 The box marks my anticipated top for the DJI. From this point, I expect a strong reversal and the beginning of a major correction.
Now here's the shocking part:
If this correction plays out in time and reaches the Fibonacci 0.382 level, that would suggest a retracement spanning up to 86 years — yes, 86 years.
This isn’t just about markets anymore — such a scenario could carry massive consequences for the global economy and society as a whole.
If, however, we see a strong breakout above the box, then the ending diagonal thesis would be invalidated, and we might instead be witnessing an extended wave 5 — complete with five internal sub-waves.
But either way — the top is coming. It’s just a matter of when, and how hard we fall.
💬 What are your thoughts? Could we really be on the edge of a generational peak?

US30: Move Up Expected! Long!
My dear friends,
Today we will analyse US30 together☺️
The in-trend continuation seems likely as the current long-term trend appears to be strong, and price is holding above a key level of 41,589.0 So a bullish continuation seems plausible, targeting the next high. We should enter on confirmation, and place a stop-loss beyond the recent swing level.
❤️Sending you lots of Love and Hugs❤️

Dow Jones breakdown or setup for 15 percent rally?The Dow looks weak but this might be the setup traders dream of. We break down two possible bullish patterns forming — an inverse head and shoulders and an ascending triangle — and explain how Trump’s EU tariffs could shape the next move. Target gains up to 15 percent with risk reward ratios as high as 7.5 to 1.
This content is not directed to residents of the EU or UK. Any opinions, news, research, analyses, prices or other information contained on this website is provided as general market commentary and does not constitute investment advice. ThinkMarkets will not accept liability for any loss or damage including, without limitation, to any loss of profit which may arise directly or indirectly from use of or reliance on such information.

KOG - US30Quick update on this as it's looking like it's stretching out early buyers and has caught some at the top.
We've added the red boxes to this and we're keeping a close eye on that lower one around 41400-500 as long as 42000 holds us down. If we get it we get it, but it needs to go straight down before going up.
As always, trade safe.
KOG

Potential downward moveUS30 has been bullish since selling to 36,500 and later retested the lower bound but settled at 37,800. Upon settling above these figures, the indice has been gradually growing, intending to touch the established highs at 42,800 and further up at 45,000. If the price action manages to stabilise above 42,800, the bullish move will still continue until the top.
However, if price fails to settle above 42,800, a bearish correction may be likely, in search of a support structure that will initiate a bullish rise again.

US30 BULLISH BIAS RIGHT NOW| LONG
US30 SIGNAL
Trade Direction: long
Entry Level: 41,822.1
Target Level: 42,718.6
Stop Loss: 41,224.4
RISK PROFILE
Risk level: medium
Suggested risk: 1%
Timeframe: 9h
Disclosure: I am part of Trade Nation's Influencer program and receive a monthly fee for using their TradingView charts in my analysis.
✅LIKE AND COMMENT MY IDEAS✅

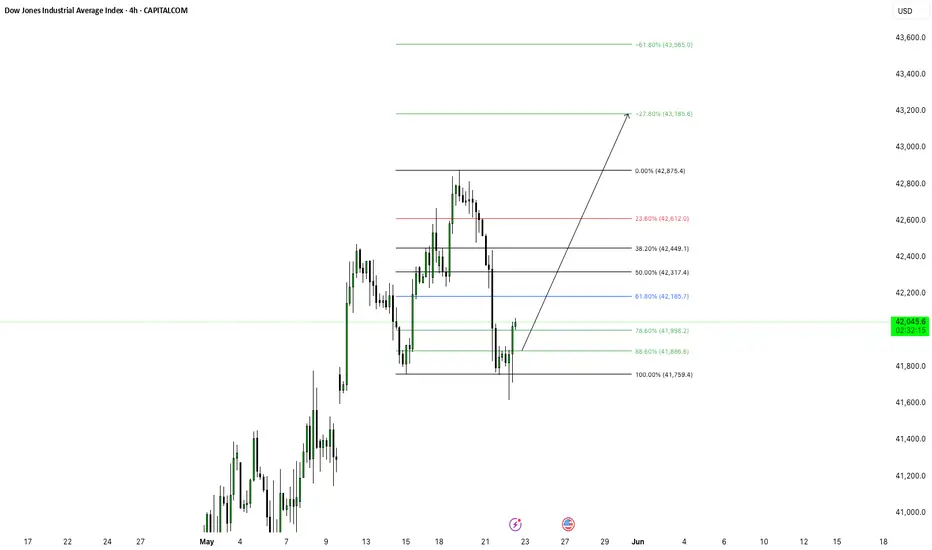
US30 (Dow Jones) – Major Demand Zone Hit! Will We See a ReversalThe US30 has just tapped into a high-interest demand zone around the 41,767.01 level, showing signs of bullish reaction after a strong selloff from the 42,800 supply area.
Here’s what I’m watching:
1. Demand Zone Bounce:
Price is holding above the demand zone (orange box), with increasing volume on the bounce – suggesting potential accumulation by smart money.
2. Immediate Resistance Levels:
We have two major upside targets:
42,288.87 – Minor resistance (possible retest zone)
42,810.50 – Key supply zone (major selloff origin)
3. Breakout Potential:
A break and close above 42,288.87 with strong volume could signal continuation toward the upper range.
4. Bullish Confluence:
Price is holding a bullish 15-min structure
Previous support flipped to resistance now acting as potential magnet
Double bottom structure visible within the demand range
Trading Idea:
If the demand zone holds and price breaks 42,012 resistance, I’ll look for longs targeting 42,800+, with stops below the recent low.
What do you think? Will US30 rocket from here or crash through the floor?
Like if you're watching this zone.
Comment your target for this week – bull or bear?

Short after liquidity grabThere we see it smooth.
Us30. I have not much to say but to just wait for profit

Dow Jones Index (US30): Time to Grow
As I predicted yesterday, US30 nicely respected
a wide daily support cluster.
A pullback from that is now confirmed with a violation
of a minor horizontal resistance on a 4H.
The index may reach 42200 level soon.
❤️Please, support my work with like, thank you!❤️
I am part of Trade Nation's Influencer program and receive a monthly fee for using their TradingView charts in my analysis.

Potential bearish drop?Dow Jones (US30) is rising towards the pivot, which lines up with the 61.8% Fibonacci retracement and could drop to the 1st support.
Pivot: 42,435.88
1st Support: 41,294.81
1st Resistance: 43,025.39
Risk Warning:
Trading Forex and CFDs carries a high level of risk to your capital and you should only trade with money you can afford to lose. Trading Forex and CFDs may not be suitable for all investors, so please ensure that you fully understand the risks involved and seek independent advice if necessary.
Disclaimer:
The above opinions given constitute general market commentary, and do not constitute the opinion or advice of IC Markets or any form of personal or investment advice.
Any opinions, news, research, analyses, prices, other information, or links to third-party sites contained on this website are provided on an "as-is" basis, are intended only to be informative, is not an advice nor a recommendation, nor research, or a record of our trading prices, or an offer of, or solicitation for a transaction in any financial instrument and thus should not be treated as such. The information provided does not involve any specific investment objectives, financial situation and needs of any specific person who may receive it. Please be aware, that past performance is not a reliable indicator of future performance and/or results. Past Performance or Forward-looking scenarios based upon the reasonable beliefs of the third-party provider are not a guarantee of future performance. Actual results may differ materially from those anticipated in forward-looking or past performance statements. IC Markets makes no representation or warranty and assumes no liability as to the accuracy or completeness of the information provided, nor any loss arising from any investment based on a recommendation, forecast or any information supplied by any third-party.

uptrendIt is expected that the downward trend will end within the current support range and we will see the beginning of the upward trend. If the support range is broken, a continuation of the downward trend to the next support levels is possible.

US30 Scalp Idea ...Market didn't give us Confirmation but market take the LQ not the very high probable trade but worth to take the little risk,

Hanzo / US30 15m Path ( Confirmed Breakout Zones )🆚 US30
The Path of Precision – Hanzo’s Market Strike
🔥 Key Levels & Breakout Strategy – 15M TF
☄️ Bearish Setup After Break Out – 41750 Zone
Price must break liquidity with high volume to confirm the move.
☄️ Bullish Setup After Break Out – 41950 Zone
Price must break liquidity with high volume to confirm the move.
🩸 15M Time Frame Confluence
————
CHoCH & Liquidity Grab @ 41820
Key Level / Equal lows Formation - 41600
Strong Rejection from 42000 – The Ultimate Pivot
Strong Rejection from 41450 – The Ultimate Pivot
🔥 1H Time Frame Confirmation
Twin Wicks @ 41750 – Liquidity Engineered
Twin Wicks @ 41450 – Liquidity Engineered

US30 - LONGPrice had the big drop as expected. Didn't quite fill the gap that I thought it would. But seeing that price has now changed momentum on the higher time frames, I am expecting it to continue to rise and create a higher high.
Support and resistance bosAfter support or resistance the market will sweep liquidity and create the first bos .the market will return to the bos with immediate effect to push the price up or down

US30... theory to take out the gapAs the high hit the resistance level early yesterday and the pattern ( Head and Shoulders ) formed more today on the HTF, I think the best way to close the gap will be a complete Head and Shoulder pattern.

One of my FAVOURITE ENTRY MODELS!!!!AMD is one of my favourite ways to get into the market. Tom Camp, my mentor, has taught me this. Accumulation, Manipulation, and Distribution is known as AMD which is a certain movement in price with in a range. When price Accumulates it consolidates, engineering liquidity on both sides of the market. When price Manipulates it targets either buy-side or sell-side liquidity first then it will target the buyside or sell-side liquidity. Meaning if you're in a bullish environment and price pulls into a HTF POI on a LTF price displays AMD where it will target buy-side liquidity first then target sell-side liquidity and price will reverse. When price distributes it retraces back into the range created in the Manipulation phase. Normally Manipulation phase price displaces or there is an inverse FVG or FVG or OB you can enter off of.

sell US30📉 Technical Indicators
As of May 22, 2025, at 1:05 PM GMT, the Dow Jones 30 Futures show the following:
Investing.com
Price: 41,880.00 USD
Technical Summary: Strong Sell
Moving Averages: Strong Sell (12 out of 12 indicators)
Technical Indicators: Strong Sell (7 out of 7 indicators)
Investing.com
+1
TradingView
+1
Key indicators include:
RSI (14): 31.72 (approaching oversold territory)
MACD (12,26): -151.76 (bearish)
CCI (14): -260.43 (oversold)
Williams %R: -0.503 (overbought)
Stochastic RSI (14): 100 (overbought)
FastBull
+5
Investing.com
+5
TradingView
+5
🔍 Footprint Chart Insights
Footprint charts, which display executed buy and sell orders at specific price levels, are valuable for assessing market sentiment. Currently, the charts indicate:
Optimus Futures
+1
Wikipedia
+1
Investing.com
Sell Imbalances: Higher volume of sell orders at key price levels, suggesting strong selling pressure.
Point of Control (POC): Located at lower price levels, indicating that the majority of trading volume is occurring at these prices, reinforcing the bearish sentiment.
Lack of Buy Imbalances: Minimal indications of strong buying interest at current levels.
📊 Market Sentiment
Recent analyses from trading communities suggest a bearish outlook for US30. For instance, a TradingView analysis notes that US30 is reacting from a strong demand zone (42,400 - 42,500), showing a possible reversal after a liquidity grab below recent lows. However, the overall trend remains bearish, and traders are advised to watch price action closely and confirm momentum before entering.
TradingView
+1
TradingView
+1
TradingView
✅ Conclusion
Given the prevailing technical indicators and order flow data, the US30 is currently in a bearish phase. Traders should exercise caution and consider waiting for clear signs of reversal or stabilization before entering long positions. Monitoring key support levels and staying updated with market news will be crucial in the coming days.
For a visual understanding of US30 order flow trading, you might find this video insightful:
