US30 Is on the move up as sellers get low buyers are winning the move pushing the price all the way up as there is a lot of pressure for the price to go all thr way higher to create a w shape as seen in the chart watch out for more buys than sells on this pair goodday
DJ30 trade ideas

US30Persistent inflation and expectations about Federal Reserve interest rate policy continue to influence investor sentiment.
Sector Performance: The rally has been broad-based, with increased activity in industrials and technology components.

US 30 Potential longUS30 – Wyckoff Spring Setup for NY Session | Intraday Execution Play
Price rallied in the London session with rising volume and structure breaks —
Now we’re anticipating a classic Wyckoff spring scenario just ahead of NY open.
📍 Key Expectations:
Sweep of intraday support around 43,482
Strong buyer reaction (spring confirmation)
Expansion into the 43,600+ zone — possible 1.5R+ continuation
⚠️ Volume buildup + stop placement below prior structure make this zone ripe for a fakeout → reversal.
I’m watching for a quick flush below the line → wick rejection → engulfing confirmation to trigger longs.
This is a trap trade — smart money baits shorts, I’m betting they get squeezed.
🔫 Entry: On confirmation after spring
📉 Invalidation: Below the spring low
🎯 Target: 43,610 zone and trailing after break of 43,570
Let them walk into the trap. Then pull the trigger.

US30 Testing Key Resistance ZonesUS30 has shown renewed bullish momentum with a strong breakout candle above the 42,800.00 resistance. After consolidating for several sessions, price surged upward, now hovering near the 43,800.00 zone—an important resistance level from prior highs.
Support at: 42,800.00 🔽 | 41,900.00 🔽
Resistance at: 43,800.00 🔼 | 44,362.79 🔼 | 45,011.92 🔼
🔎 Bias:
🔼 Bullish: A daily close above 43,800.00 opens the path to test 44,362.79 and potentially 45,011.92.
🔽 Bearish: Rejection from current level and a break below 42,800.00 may trigger a pullback toward 41,900.00.
📛 Disclaimer: This is not financial advice. Trade at your own risk.

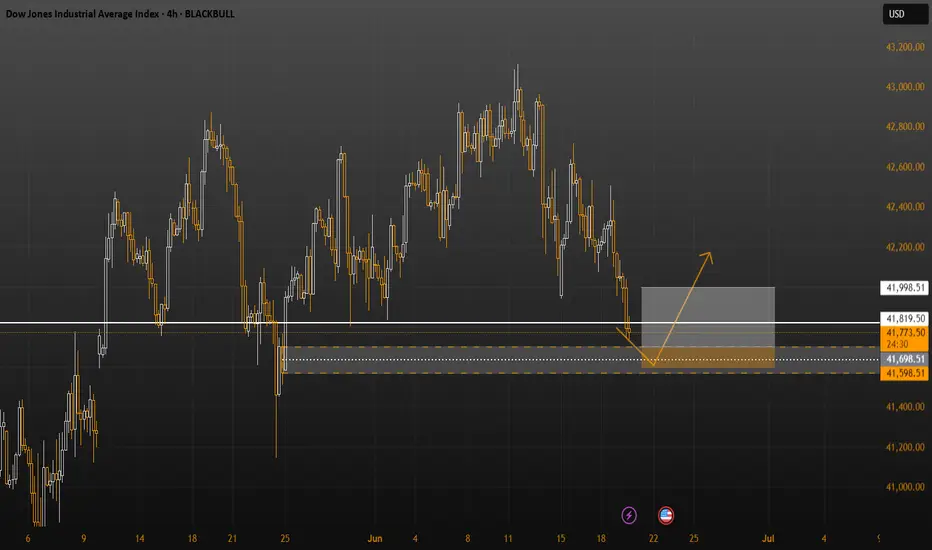
The Dow Jones Index reboundsUS indices rebounded following the US president’s announcing a ceasefire deal in the Middle East, which brought some optimism to the markets and among investors, positively impacting US markets in particular.
The Dow Jones Index rose at the start of this week by approximately 2.62%, reaching a new high above the 42,711 level, which represents the last lower high recorded by the market. A breakout above this level could indicate a shift in trend from bearish to bullish.
If the price pulls back to the 42,025.62 level, it would be considered a corrective move, with a possible upward rebound from that level aiming to target 42,719.99 and potentially continue the bullish trend in the long term.
However, if the price falls below the 41,755.45 level and a four-hour candle closes below it, the positive scenario mentioned above would be invalidated.

US30 ShortElite Live Analysis – US30
Market Structure: Bearish across the Weekly, Daily, and 4H timeframes.
Key Level: Price has tapped into a significant zone, aligning with higher timeframe bias.
1H Confirmation: Price also tapped into a 1H Order Block and showed clear rejection, further validating downside potential.
Expectations:
Anticipating a strong move to the downside in alignment with market structure.
Targets:
Structured liquidity resting below
Liquidity pools beneath current price

Dow Jones Potential UpsidesHey Traders, in today's trading session we are monitoring US30 for a buying opportunity around 41,900 zone, US30 is trading in an uptrend and currently is in a correction phase in which it is approaching the trend at 41,900 support and resistance area.
Trade safe, Joe.

US30 on Track for 43KHappy Monday, traders.
Here’s my latest analysis and trade idea for US30. Since April 6th, US30 has been in a strong bull run, breaking above the descending weekly trend line while continuing to print higher highs and higher lows.
Although price action has shown some uncertainty since May 22nd, the bigger picture remains bullish it’s just noise. The trend is intact, and we’re now pushing back above the 50 EMA.
Currently, US30 is forming a wedge between two descending trendlines I’ve marked on the chart. I expect some consolidation within this structure, with a potential pullback into my entry zone.
From there, I’m anticipating another short-term push higher, with a target in the Golden Zone between 43,100 and 43,400 . My entry range is between 42,179 and 42,481 , with a stop-loss just below the current swing low at 41,980.
I expect this move to develop sometime within the next couple weeks.
What do you think will it play out? Let me know in the comments.
PEPPERSTONE:US30

DOW JONES about to skyrocket based on the Gold/Silver ratio!Dow Jones (DJI) has been basically consolidating for the past month or so, following the massive April 7th bottom rebound but there is a very distinct indicator that shows it is about to skyrocket.
That is the Gold/ Silver ratio (blue trend-line). Gold (XAUUSD) as a safe haven, attracts capital in times of market uncertainty. Silver (XAGUSD), as a metal of industrial use, attracts capital in times of economic boom and prosperity.
In the past 6 years more particularly, every time the Gold/ Silver ratio declined, Dow started rising aggressively (exception July-Aug 2019, when the market rose straight after), as investors clearly showed their risk-on appetite by buying Silver (optimism) at the expense of Gold (fear).
Dow's current consolidation indicates that there may be high accumulation in the past month and the ratios extended decline suggests a skyrocket move is up next.
-------------------------------------------------------------------------------
** Please LIKE 👍, FOLLOW ✅, SHARE 🙌 and COMMENT ✍ if you enjoy this idea! Also share your ideas and charts in the comments section below! This is best way to keep it relevant, support us, keep the content here free and allow the idea to reach as many people as possible. **
-------------------------------------------------------------------------------
💸💸💸💸💸💸
👇 👇 👇 👇 👇 👇

dji looking to rebound after 2 days on the rough marketThe fib circle looks to be showing an upward trend. Notice how the blue circle is completely overtaken and the drop yesterday. Showing that a potential reversal is within both levels. Seeing how this formation is. Looking to be on a continuous volatility for the djia.
If someone could look at this and if you would, I ask for an opinion?

US 30 the 5th wave US 30 the 5th wave this is not an impulse wave totally.
just the conflict of is going to be peace so if we look at OIL we can see everything is good.

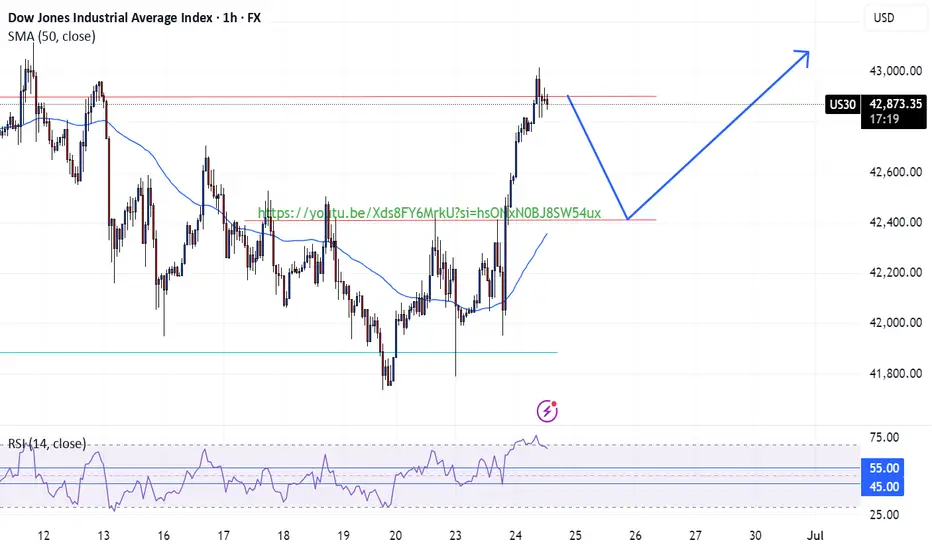
US30 Long Opportunity US30 shows strong bullish confluences at the opening of the week, currently testing the resistance level at 42,900. Price is above above the 50 SMA and favors bullish momentum per the RSI above 55.
Potentially retracement towards the break and retest level at 42,400 where we could see a potential continuation of the bullish trend after the market collects enough liquidity.
This is support by fundamentals of the day being the cease fire between Iran-Israel. investor more comfortable taking risks and stepping back into the indices.
Dow Jones Gains on Rate Cut Hopes and Ceasefire Relief US30 OVERVIEW
Wall Street Rises on Fed Rate Cut Hopes and Geopolitical De-escalation
The Dow Jones (US30) remains under bullish pressure, supported by rising expectations of a Federal Reserve rate cut later this year and a ceasefire agreement between Iran and Israel, which has eased market tensions.
TECHNICAL OUTLOOK – US30
The price maintains a bullish bias as long as it trades above the pivot level at 42,810, with upside potential toward the key resistance at 43,210.
A short-term bearish correction is possible toward 42,810 or even 42,670, but the broader structure remains bullish above these levels.
Resistance Levels: 43,060 → 43,210 → 43,350
Support Levels: 42,670 → 42,420 → 42,160
A sustained break below 42,670 could signal deeper correction, while a clear move above 43,210 would confirm continued bullish momentum.

short within and without rangesbasicly i dont know what will happen
do i predict?
yes
do i react?
maybe

DowJones INTRADAY key trading levelsKey Support and Resistance Levels
Resistance Level 1: 43200
Resistance Level 2: 43550
Resistance Level 3: 43900
Support Level 1: 42240
Support Level 2: 41740
Support Level 3: 41280
This communication is for informational purposes only and should not be viewed as any form of recommendation as to a particular course of action or as investment advice. It is not intended as an offer or solicitation for the purchase or sale of any financial instrument or as an official confirmation of any transaction. Opinions, estimates and assumptions expressed herein are made as of the date of this communication and are subject to change without notice. This communication has been prepared based upon information, including market prices, data and other information, believed to be reliable; however, Trade Nation does not warrant its completeness or accuracy. All market prices and market data contained in or attached to this communication are indicative and subject to change without notice.

US30 TodayUS30 Today is still bearish
My SSM structure is still down
I'm waiting to open US and looking good entry

Lets See How It Plays out. TP1 Secured.Break of trenline and rejection from GAP+FVG.
Sweep of $$$ Liquidity from and Equal Lows.

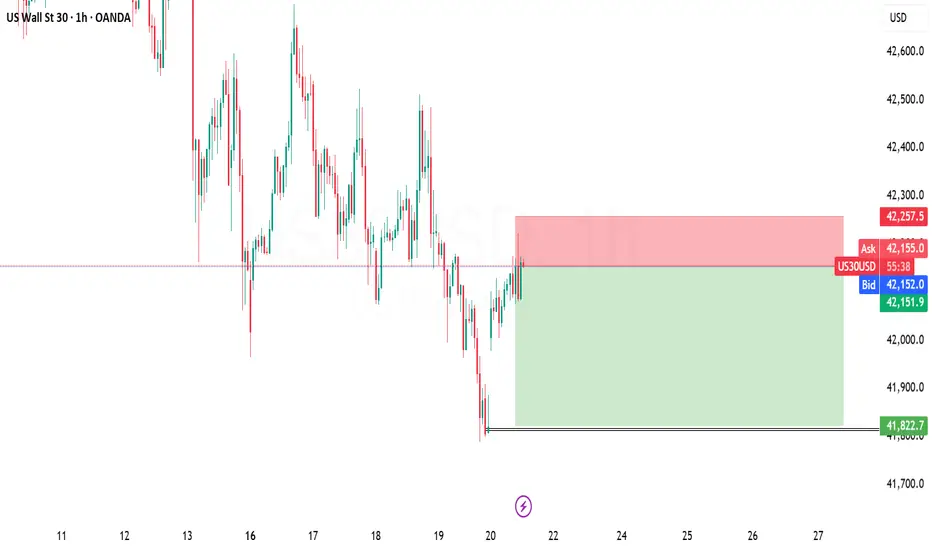
US30 Sell IdeaWe see price beginning to downtrend forming LL & LH. We also see price beginning to get closer to our daily low. Now we enter off of the 2nd mitigation of the bearish engulfing located at our point of interest on the 1hr. Really nice signature setup here. Overall I feel good I really took my time finding this setup!
US30 next target releasedNo comment needed. All information is in the chart analysis.
Steps to follow:
Analyze yourself.
Take the position with SL and Take Profits.
Wait, it may take a couple of days, so take a break and step away from the screen from time to time, just like I do :)
Get the result.
I will update the trade every day.
Like, comment with your good mood or viewpoint, share with your circle. It’s together that we get stronger!
Good trades, Traders!
The golden bear

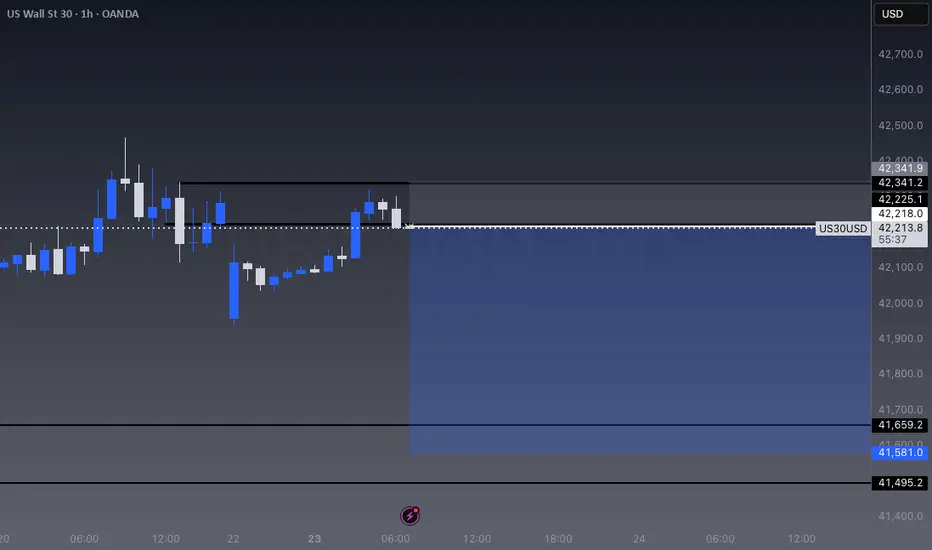
US30 Under Pressure as Geopolitical Risks Drive VolatilityUS30 – Technical Overview
Dow Jones (US30) futures are trading lower amid escalating tensions in the Middle East, with markets closely monitoring any potential U.S. response that could significantly sway sentiment.
⚠️ Volatility remains elevated, and traders should remain cautious ahead of potential geopolitical developments.
US30 continues to trade below the key level at 42160, maintaining a bearish bias.
As long as the price stays below this level, further downside remains likely.
However, the market is also testing the pivot zone, and a confirmed break above 42160 could trigger a bullish move toward 42410.
Key Levels:
• Pivot: 42160
• Support: 41900 / 41780 / 41310
• Resistance: 42310 / 42410 / 42580

SELL US30 - TO CLOSE GAPIn 5 min TF - retesting FVG.
There is also a H&S pattern forming - 5 min TF
Selling for the rest of the day
US30 LONGSAlthough the hourly may ne considered bearish, we are currently approaching a respected support zone as seen from the 4h and above.
I have highlighted a strong 4h Demand as a potential point of entry, unsure about long target and stop loss zones, so I personally will be sticking to my ratioed take profit as usual - 100:300.
I do hopefully see some strong bullish movement coming in over the next few days.
Strictly technical analysis
lankss
US30 TodayUS30 Today is still bearish
My SSM Reversal Pattern is comming.
This is just my view of course
