DOW JONES: Will the 4H MA200 produce a rally?Dow is neutral on its 1D technical outlook (RSI = 51.949, MACD = 356.820, ADX = 20.639), trading between its 4H MA50 and MA200 in the past 2 days. The price just hit the 4H MA200 for the 2nd time again at the bottom of the Channel Up. As long as it holds, the pattern can initiate the new bullish wave. We exepct it to repeat the +3.74% rise of the one before, TP = 43,550.
See how our prior idea has worked out:
## If you like our free content follow our profile to get more daily ideas. ##
## Comments and likes are greatly appreciated. ##
DJ30 trade ideas

DOW JONES Analysis This is U30 through my current lens, investigations of price action from W - D - 4H suggest Bullish.
factoring in the current fundamental conditions, I observe the US Dollar.
Monitor the US100 & US500 for any irregular correlation in price delivery between the 4H - 15M
I seek price to attack "Highs" and sustain strong "Lows".

US30 Is Bearish! Sell!
Here is our detailed technical review for US30.
Time Frame: 12h
Current Trend: Bearish
Sentiment: Overbought (based on 7-period RSI)
Forecast: Bearish
The market is approaching a significant resistance area 42,254.4.
Due to the fact that we see a positive bearish reaction from the underlined area, I strongly believe that sellers will manage to push the price all the way down to 41,307.3 level.
P.S
Overbought describes a period of time where there has been a significant and consistent upward move in price over a period of time without much pullback.
Disclosure: I am part of Trade Nation's Influencer program and receive a monthly fee for using their TradingView charts in my analysis.
Like and subscribe and comment my ideas if you enjoy them!

Bull Run To New Highs?The Dow got slammed on Wednesday, down 2%, no follow through yesterday.
Despite all the look of this rally being a bounce to sell, notice the uptrend line of support developed, this is the dynamics of markets, morph and twist to shake out weaker hands.
Would not be surprised to see a resumption of this rally to all time highs into June/July, the tariff wobbles are gone for now, any firm close below the trend line changes the trend.
We buy this market now at support in prospect of a larger rally to resume.
Appreciate a thumbs up, Good Trading & God Bless you all!

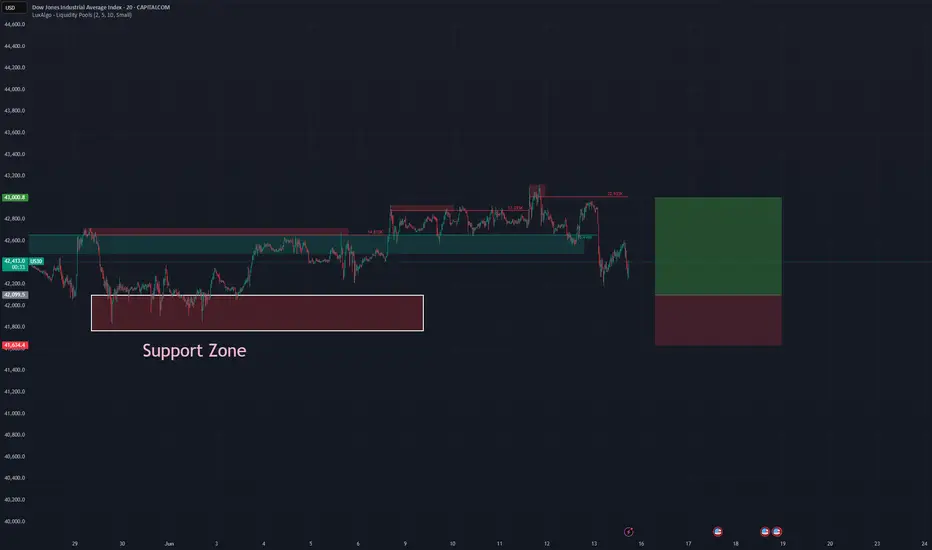
DOW Might Recover From Today's LossesIsrael's attack on Iran's nuclear facilities has unsettled the markets. After a weak start, the indices, such as the DJIA, initially made little headway and were unable to recover their losses.
We do not expect the markets to plunge to their doom now, but to recover soon.
For the Dow, we initially expect new lows in the entry area shown and then a recovery to the target zone in the coming week.
Dow Jones Wave Analysis – 1 July 2025
- Dow Jones broke the resistance zone
- Likely to rise to resistance level 45000.00
Dow Jones index recently broke the resistance zone located at the intersection of the resistance level 44000.00 (former top of wave iv from March) and the resistance trendline of the daily up channel from May.
The breakout of this resistance zone accelerated the active impulse wave (3) – which is part of the multi-month upward ABC correction 2 from April.
Dow Jones index can be expected to rise to the next resistance level 45000.00 (target price for the completion of the active impulse wave (C)).

US30Market Drivers
Rotation: Investors are shifting from tech to industrials and other Dow components to start the second half of 2025.
Trade Policy: Optimism over potential US trade agreements and a 90-day delay in new tariffs has supported the rally.
Technical Outlook: The overall momentum is bullish and first resistance at 45.043

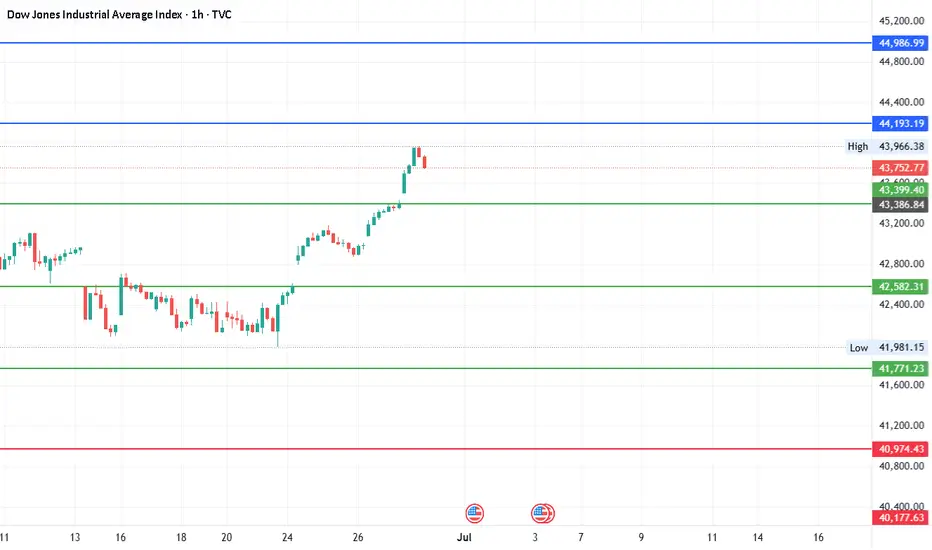
#DJI - Pivot is 42582.31 | Target 38374.12 or 46790.50?Date: 27-06-2025
This is in continuation with the previous post of 8000 points target. We have a new pivot point for the next move.
#Dow Jones Current Price: 43880.
Pivot Point: 42582.31 Support: 41771.23 Resistance: 43399.40
#Dow Jones Upside Targets:
Target 1: 44193.19
Target 2: 44986.99
Target 3: 45888.75
Target 4: 46790.50
#Dow Jones Downside Targets:
Target 1: 40974.43
Target 2: 40177.63
Target 3: 39275.875
Target 4: 38374.12
US30: Bears Are Winning! Short!
My dear friends,
Today we will analyse US30 together☺️
The market is at an inflection zone and price has now reached an area around 44,041.6 where previous reversals or breakouts have occurred.And a price reaction that we are seeing on multiple timeframes here could signal the next move down so we can enter on confirmation, and target the next key level of 44,013.0..Stop-loss is recommended beyond the inflection zone.
❤️Sending you lots of Love and Hugs❤️

US30 Technical Outlook – 07/01/2025📍 US30 Technical Outlook – 07/01/2025
Monster rally continues! 🚀 Price exploded off the 42,100–42,200 demand zone and has now pushed deep into the 44,150–44,250 major resistance area.
🧠 Key Observations:
Trend remains extremely bullish ✅
Price is consolidating just under 44,250 resistance 📍
EMAs (43,894 and 44,052) still showing strong upward momentum ✅
📊 Key Price Zones:
🔼 Major Resistance: 44,150 → 44,250 → 44,400
🔽 Key Support: 43,800 → 43,600 → 43,400
📈 Trade Setup Ideas:
🔹 Long Bias:
Pullbacks into 43,800 → 43,600 support
Look for bullish continuation setups if price stays above EMAs
Target: Breakout toward 44,250 → 44,400
🔻 Short Bias (Countertrend / Caution):
Only look for short scalps if price gives clear rejection (wicks, bearish engulfing, etc) from 44,250–44,400 zone
Possible downside target: 43,800–43,600

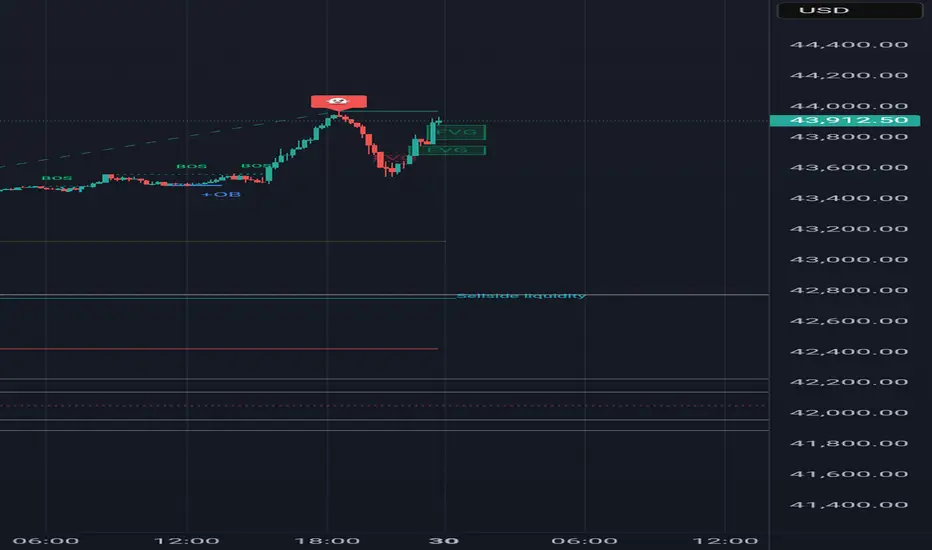
US30 Buy SetupI have two zones for US30 Buy but I think price should trigger my limit to take out the BSL(Buy Side LIq) before going down

Look into it{
"alerts": [
{
"name": "US30 Bull Break",
"condition": {
"symbol": "US30",
"operator": "crossing",
"value": 43950
},
"message": "📈 US30 Breakout Alert: Price crossed above 43,950. Watch for BUY setup targeting 44,100.",
"actions":
},
{
"name": "US30 Bear Rejection",
"condition": {
"symbol": "US30",
"operator": "crossing_down",
"value": 43800
},
"message": "📉 US30 Bearish Rejection: Price fell below 43,800. Watch for SELL setup toward 43,400 OB.",
"actions":
}
]
}
US30 looking for the short on Bearish PAI believe we can expect a pull back down to JuBias: Short-term Bearish (Contingent Setup)
Context: Price is currently trading just below a high-probability supply zone between 44,048 – 44,277. This area aligns with prior highs and liquidity, making it a prime zone to look for a short-term rejection if strong bearish price action (PA) appears on the 4H or Daily timeframes.
We are currently seeing strong bullish momentum on the Weekly, Daily, and H4 candles. Any short positions from this zone must be reactive — not anticipatory. A clear bearish signal (e.g., engulfing, structure break, supply confirmation) is required to consider entry.
Key Zone:
Seek bearish PA between 44,048 – 44,277
Contingency: If price breaks and closes above 44,250 (2024 highs), expect continuation toward 45,000
Short Targets if Rejection Occurs:
Target 1: 43,350
Target 2: 42,500
Extended Target: 41,734 (June Low)
Post-Rejection Bullish Scenario:
If we do get a rejection and targets are met, we will then look for bullish PA in the demand zones (42,500 or 41,700) to consider long setups back toward the 2024 highs and potentially beyond.
Breakout Scenario:
If price breaks and closes above the 44,277 zone early this week, we anticipate the next leg to 45,000 before any meaningful reversal.
At this stage, it’s a waiting game — let price action lead. We don’t predict, we react.ne lows before an

Weekly Forex Outlook Sun.June.29.2025 - Fri.July.4.2025Like and Comments would be appreciated :D Not Financial Advice, Just my outlook/opinion

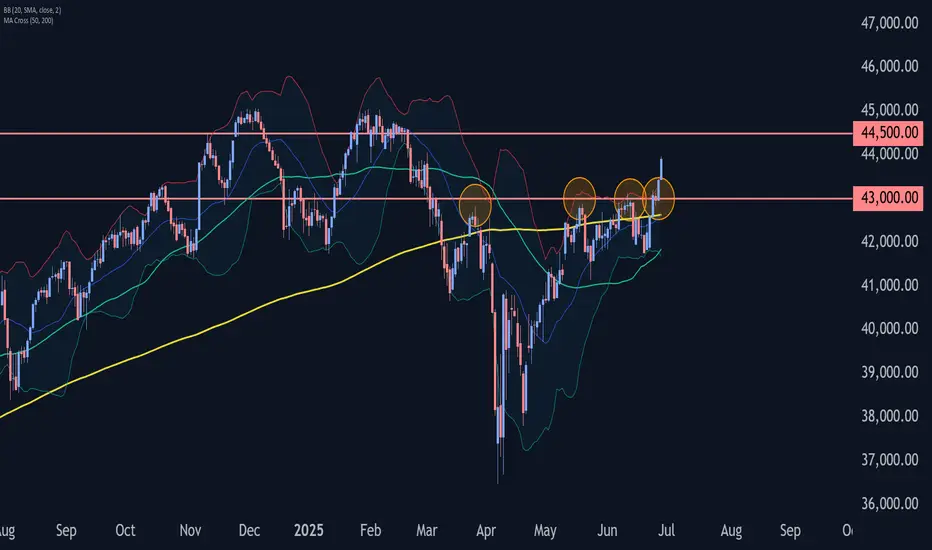
Dow Jones Wave Analysis – 27 June 2025
- Dow Jones broke pivotal resistance level 43000.00
- Likely to rise to resistance level 44500.00
Dow Jones index recently broke above the pivotal resistance level 43000.00 (which has been reversing the price from the end of March, as can be seen from the daily Dow Jones chart below).
The breakout of the resistance level 43000.00 accelerated the active impulse wave 3 of the intermediate impulse wave (C) from the end of May.
Dow Jones index can be expected to rise to the next resistance level 44500.00, which is the target price for the completion of the active impulse wave (C).
#DJI - 5000 Pts already moved out of 8000 points..Date: 27-06-2025
#DJI - 5000 Pts already moved out of 8000 points as posted on 22nd April. Another 3000 points to cover. we have different pivot for the next level up and it will be shared soon.
Old levels are as follows.
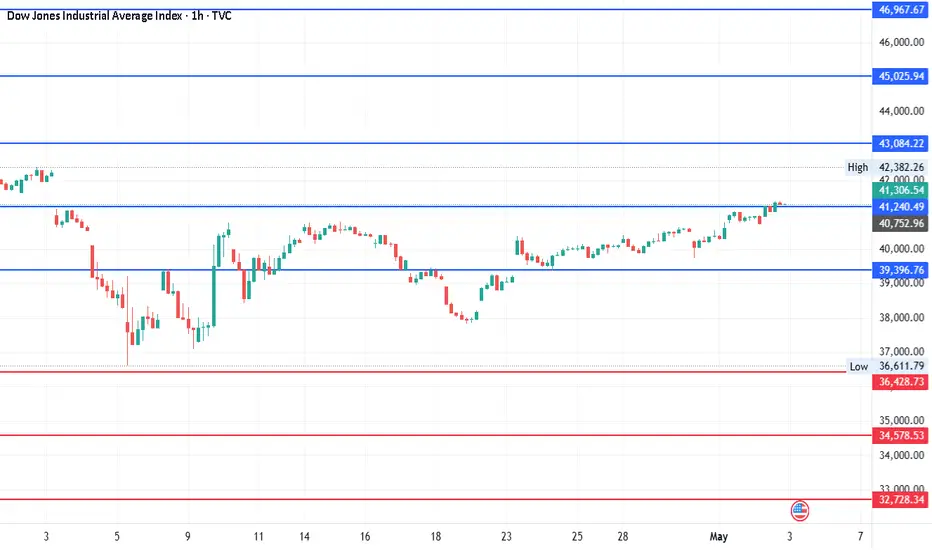
#DJI Upside Targets: 41240.49, 43084.22, 45025.94 and 46967.67
#DJI Downside Targets: 34578.53, 32728.34, 30786.61 and 28844.88
Current price is around 43,870 at the time of this post.
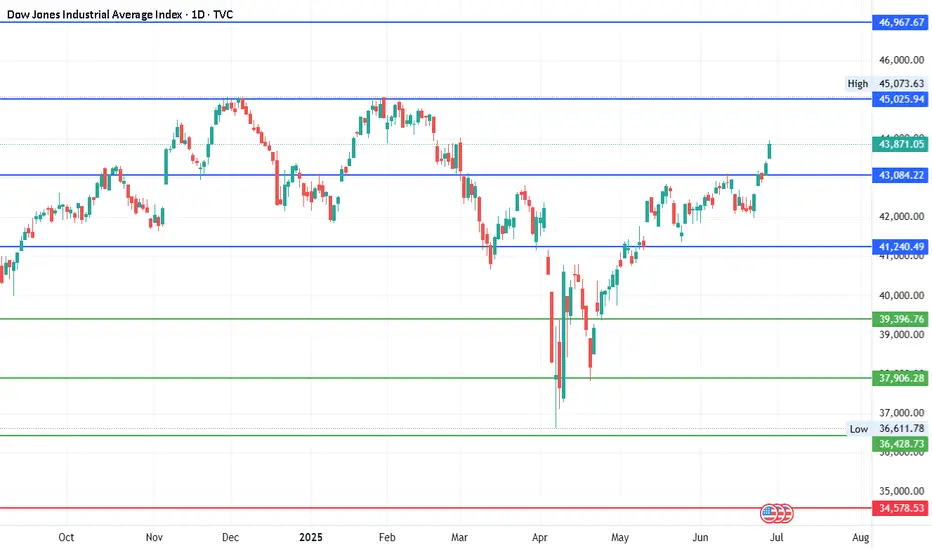
DJI - 2000 pts already moved out of 8000 pts since last posted?It has already moved around 2000 points since last posted on 22nd April. Expecting around 8000 points moved as per mentioned earlier and the levels are still the same. Introduced additional levels for the better understanding. So, another 6000 points move pending before any reasonable correction? let's see.
Upside: 41240.49, 43084.22, 45025.94 and 46967.67
Downside: 34578.53, 32728.34, 30786.61 and 28844.88
#US30 Buy 43575.4#US30 Buy 43575.4
SL 43515.4
TP 43595.4
TP 43675.4
TP 43815.4
Trade at your own risk
Protect your capital
The Wizard 🧙♂️ SWFX

DOW JONES Will Keep Growing! Buy!
Hello,Traders!
US30 is trading in an
Uptrend and the index broke
The key horizontal level
Around 43,200 and the
Breakout is confirmed so
We are bullish biased
And we will be expecting a
Further bullish move up
Buy!
Comment and subscribe to help us grow!
Check out other forecasts below too!
Disclosure: I am part of Trade Nation's Influencer program and receive a monthly fee for using their TradingView charts in my analysis.

Dow Jones (US30) — Bullish Momentum, But a Retest AheadUS30 — Preparing for a Retest Before Higher Push
Subtitle: Technical Outlook — 27 June 2025
📈 Current Market Condition
The US30 index has shown strong bullish momentum, breaking above prior resistance around 43,000 and extending towards 43,500. Price is currently above both the 50 EMA (blue) and 200 EMA (red), reflecting a bullish structure. However, the Stochastic indicator signals overbought conditions, suggesting the index may be due for a pullback or consolidation before attempting to break higher into the 44,500–44,750 resistance zone.
🔑 Key Technical Highlights
Structure: Price broke above consolidation zone 42,750–43,000, retesting higher levels.
50 EMA (blue): Positioned near 42,750, acting as dynamic support.
200 EMA (red): Below at 42,200, major trend support.
Stochastic: Overbought — risk of a short-term correction or sideways move before continuation.
Resistance: Major resistance at 44,500–44,750.
Support: Immediate support at 43,000–43,250, deeper at 42,500.
📝 Trade Plan
Bullish Breakout (Long)
Trigger: Retest and hold of 43,000–43,250 zone with bullish confirmation (e.g. bullish engulfing, hammer).
Target: 44,500 / 44,75
Stop-loss: Below 42,900
Bearish Rejection (Short)
Trigger: Strong rejection from 44,500 with bearish reversal pattern.
Target: 43,250 / 42,750
Stop-loss: Above 44,700
Dip Buy
Trigger: Price tests 42,750 (50 EMA) and shows bullish reversal.
Target: 43,500 / 44,500
Stop-loss: Below 42,500
⚠️ Risk Management Note
US30 is trading in extended conditions, so chasing price here carries risk of getting caught in a pullback. Use staggered entries and adjust position size relative to volatility. Watch out for upcoming macroeconomic releases that could trigger sharp moves.
If you found this analysis valuable, kindly consider boosting and following for more updates.
Disclaimer: This content is intended for educational purposes only and does not constitute financial advice.

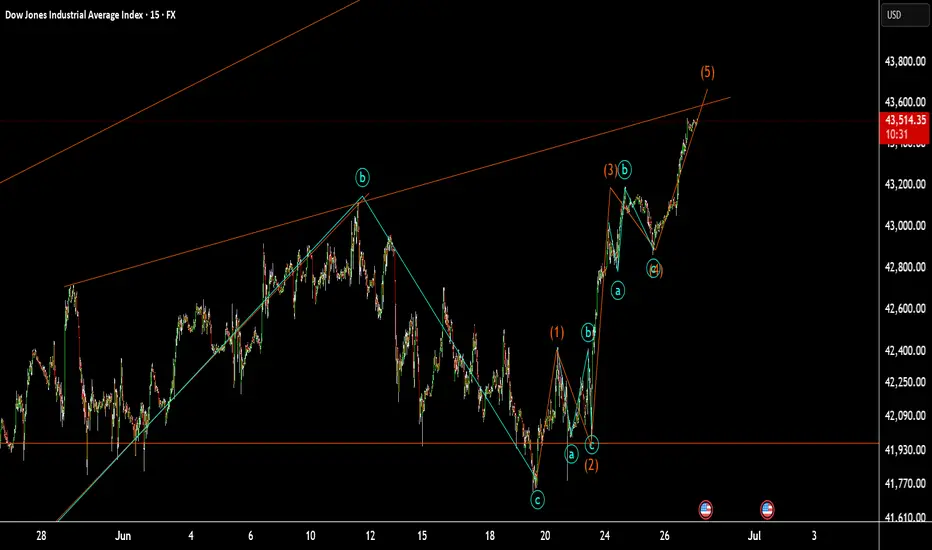
US30 at small resistanceUS30 at small resistance:
as I counter these wave we are in wave 5. it might be goes up to the maim trend Line in previous analysis.
The Dow Jones index is at the channel’s ceiling.The Dow Jones index, upon reaching the channel’s ceiling, shows weakness and lacks the ability to break out from a price action and candlestick perspective. I expect the price to reach near the channel’s floor in a downward trend.
17:30
BLACKBULL:US30

